kaggle :Plotly_Treemap (Q8)
kaggle dictation (01)
plotly.graph_objects as go : 를 이용한 Treemap
- 많은 계층 구조 데이트를 표현할때 적합.
- Ben Shneiderman에 의해 1990년도부터 출발
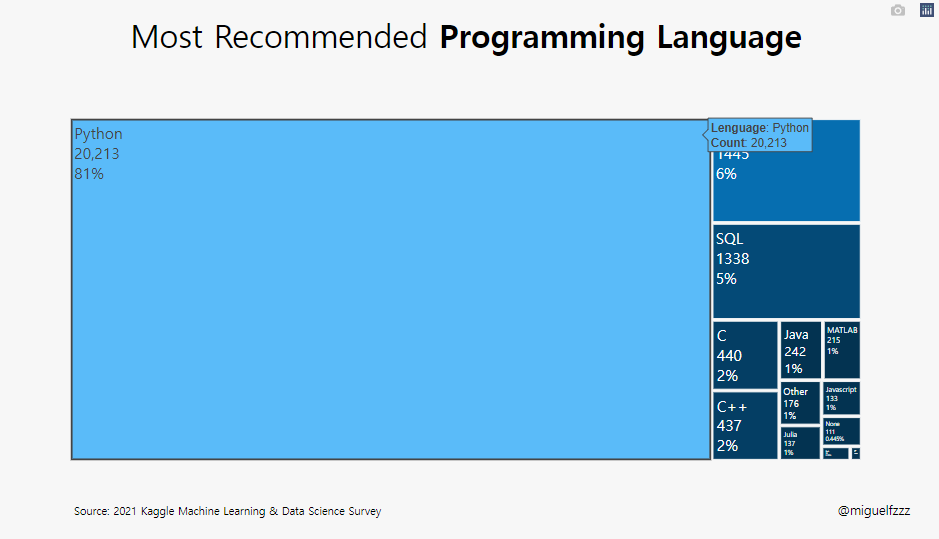
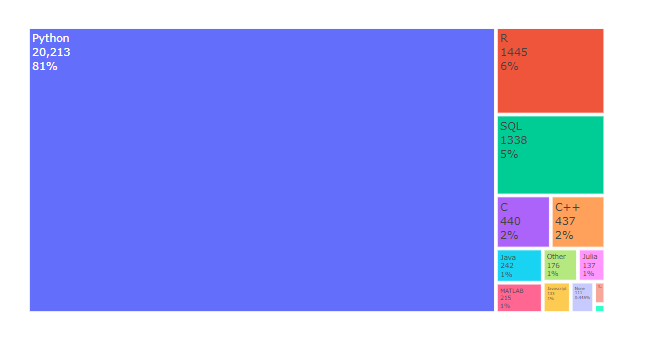
- Treemap은 크기(count) 순서로 %에따라 공간을 차지하는 사각형으로 표현됨.
- 계층에서 동일한 수준에 속하는 각 사각형 집합은 데이터 테이블의 표현식 또는 컬럼을 표현.
- 계층에서 동일한 수준의 개별 사각형은 컬럼의 Index
언제 사용하면 좋을까
- 많은 범주간의 부분과 전체를 시각화 하고 싶을때
- 범주 간의 정확한 비교 대신 큰 특징을 나타내고 싶을때
- 데이터가 계층을 이루고 있을때
사용한 Library
1 | import pandas as pd |
사실 이 부분에서 seaborn을 사용 했는지 잘 모르겠음.
github에서 plotly가 동적 Livrary라 자꾸 오류가남.
data import
data 원문
data import 방법
data는 Kaggle의 the-typical-kaggle-data-scientist-in-2021 data를 이용하였음.
data 불러오기/합치기
data를 표현 해 주기 위해 컴퓨터가 읽을 수 있는 형태로 가공.
1 | df = pd.read_csv('../input/kaggle-survey-2021/kaggle_survey_2021_responses.csv') |
df : data frame에 file 연동.
df.iloc[1:, :] : 1행부터 끝까지 건너뛰기 없이 선택
행번호(row number)로 선택하는 방법 (.iloc)
label이나 조건표현으로 선택하는 방법 (.loc)
Ref. loc, iloc을 이용한 행 선택
data encoding (Feature Engineering)
사실 이 부분이 feature Engineering에 해당하는 부분인지 잘 모르겠다.
이 부분은 data를 computer로 자동화하여 계산, 동적 그래프를 만들기 위한 부분.
###Feature Engineering
####data frame 설정
1 | recommend_leng = ( df['Q8'] |

dataframe[Q8] : data를 가공하여 분석 할 예정
- pd.value_counts()
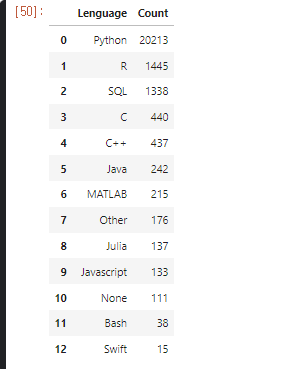
- Q8의 data counting, 중복된 data 를 counting 하여 수를 나타냄.
- pd.frame()
- dataframe으로 표의 형태를 잡아준다.
- pd.reset_Index()
- Q8의 Index reset, 원본 data에는 영향을 주지 않으면서 새로운 Index 생성
- Reset_parameter/Ko
- pd.rename()
- columns에 Index를 붙여 호출 하기 위해 이름을 바꿔줌
- index는 Lenguage로, count는 Q8로
- pd.sort_values()
- count 값으로 정렬
- by=[‘Count’], ascending = false
- by에 option 기준, (오름차순 = F )= 내림차순으로 정렬
앞으로 사용 할 색상을 미리 지정
- 한 눈에 보기 편함.
1 | colors = ['#033351',] * 13 |
아직 잘 모르겠는 부분은 왜 colors = [‘#NNNNNN’, ] 이 부분과 *13 이부분
Treemap 생성
1 | fig = go.Figure(go.Treemap( |
fig 생성
- import plotly.graph_objects as go
plotly의 graph_objects 를 이용하여 객체 생성.
Treemap의 parameter
- labels : values 이름
- values : 값
- parents : ???
- textinfo = 표시형식
fig.update_traces(hovertemplate)
1 | fig.update_traces(hovertemplate='<b>Lenguage</b>: %{label}<br><extra></extra>'+ |

- fig.update_traces()
- 그래프 위에 캡션 다는 기능
- Perform a property update operation on all traces that satisfy the specified selection criteria
- 지정된 선택 기준을 충족하는 모든 추적에 대해 속성 업데이트 작업 수행 (?? 전혀 모르겠군 !)
- hoverinfo : 마우스 오버시 나타나는 추적정보
- hovertemplate : 커서를 가까이 대면 나오는 창을 렌더링하는데 사용되는 Temp
- 변수 : %{variable} (변수의 형식을 지정)
- 숫자 : %{d3-format}
- price : %{yL$.2f}
- 변수 : %{variable} (변수의 형식을 지정)
fig.update_layout()
fig의 layout을 설정.
hoverTemp까지 설정된 treemap.

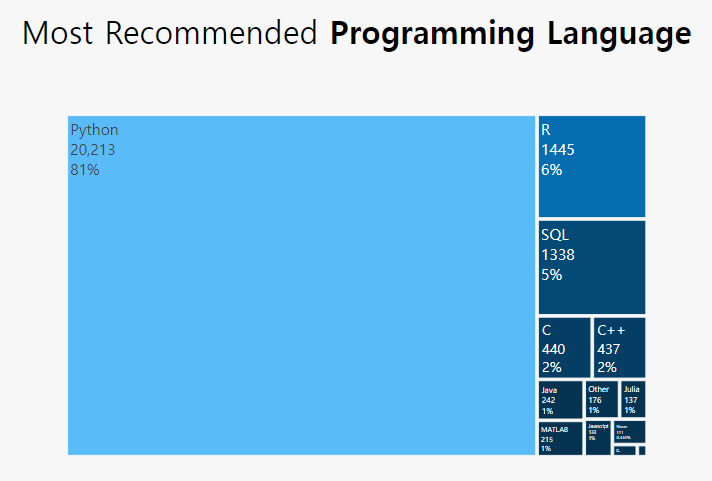
fig.update_layout()을 사용하여 layout을 변경 해 보자.

1 | fig.update_layout(showlegend=False, |
- showlegend = False
- 래전드를 보여줄지 : 안보여줌
- treemapcolorway = colors
- 위에서 정의 해 준 colors가 13개였는데 여기 계층도 13개임
- 아마도 light 부터 deep으로 색이 정해지는듯.
- 위에서 정의 해 준 colors가 13개였는데 여기 계층도 13개임
- margin=dict(pad=20)
-dic에는 여러가지가 올 수 있는데 여기서는 dict(pad)를 사용- padding을 설정, 축과 그래프 사이의 패딩을 px 단위로 설정
- Sets the amount of padding (in px) between the plotting area and the axis lines
- layout-margin
- paper_bgcolor=’#F7F7F7’
- 배경색 설정

- plot_bgcolor=’#F7F7F7’
- 설정 바꿔 보았으나 안보임
- height=600
- plot size 설정
- yaxis={‘showticklabels’: False}
- y축의 showticklabels 설정 : 안함
- yaxis_title=None, xaxis_title=None
- y축 제목, x축 제목 설정 : 없음
- title_text=”Most Recommended Programming Language“
- 제목 달기 <b> code는 bolde tag인듯.
- title_x=0.5, title_y=0.95,
- 제목의 위치 (상단 고정)
- font=dict(family=”Hiragino Kaku Gothic Pro, sans-serif”, size=17, color=’#000000’),
title_font_size=35)- title의 font 설정 (Default: “”Open Sans”, verdana, arial, sans-serif”)
- font 설정
- family, color, size 설정 가능, title_fond도 함께 설정 가능 해 보임.
fig Information 추가
fig.add_annotation() _1
플롯에 메모를 남길 수 있는것. 코멘트나 copy-Right 같은걸 남기는듯
-[plotly-annotation/ko.] (https://soohee410.github.io/plotly_annotation)
1 | fig.add_annotation(dict(font=dict(size=14), |
dict = dictionary
A list or tuple of dicts of string/value properties where:
The ‘type’ property specifies the trace type
- 여기서 dict는 fig객체 즉 plotly.graph_objects.Figure 에서 상응하는 정보(font, size등) 변수를 가져와 대응 시켜 주는 역할을 한다.
plot 아래에 보면 “@miguelfzzz”이라는 글자가 보이는데 이것을 설정 한 것.
- showarrow=False,
- 화살표등을 남길 수 있는데 이 Graph에선 false
- xref=”paper”, yref=”paper”
- 어느 부분 (plot or paper)에 표시 할 것인지
나머지는 말 안해도 이제는 알 수 있기 때문에 생략.
fig.add_annotation() _2
1 | fig.add_annotation(dict(font=dict(size=12), |
fig.show() 내보내기
1 | fig.show() |
fig.show()로 마무리 해 주면 된다.
이건 java의 return과 같은 느낌인듯.
kaggle :Plotly_Treemap (Q8)
https://yoonhwa-p.github.io/2021/11/08/kgg/Kgg_plotly_treemap/
install_url to use ShareThis. Please set it in _config.yml.