How Popular is kaggle in Africa?
1. Introduction
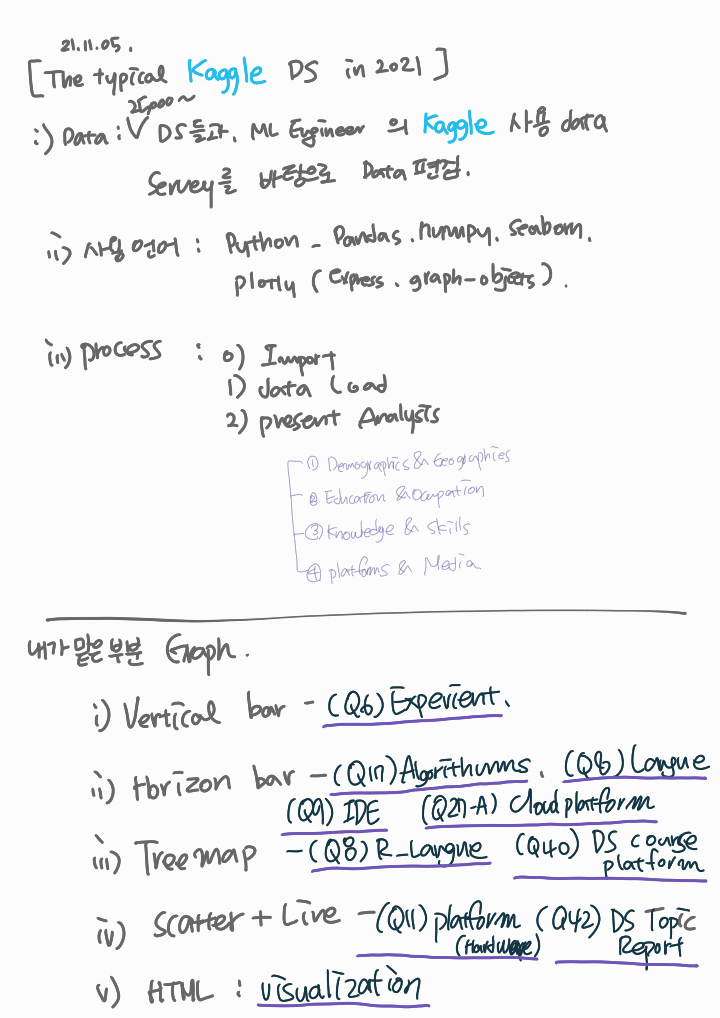
1.1 Introduction
800 사용자가 사용하고 있는 글로벌 온라인 커뮤니티 케글. 194개의 나라에서 사용중.
2017년부터 머신러닝과 data 과학자들을 대상으로 설문을 했는데, 본 저자는 아프리카 나라들의 참여를 알아보고자 한다.
Historical overview 이용
1.2 Table of Contents
How does Africa compares with rest of the world?
- (Region(Q3)) 응답자 수(Africa/전체, 2021): bar-H
- (Region(Q3)) Africa에서 kgg사용증가 : bar
Which African countries are kaggle-aware?
- (Q3) kgg을 사용하는 Africa나라 (2021): plotly_choroplethMap
- (Q3) kgg 사옹 증가 나라별 in Africa : heatmap
- (Q3) 조사에 참여한 나라 비율 in Africa (2021): Pie-Chart(donut)
-
- (Q1) age / (Q2) gender (Africa/전체, 2021): bar /bar-H
- (Q2, Q2, Q2, Q1, Genderselect) African 여성 비율 : bar
Education, Jobs and Experience
- (Q4)학력/ (Q5)직업/ (Q6)경력 (Africa/전체, 2021): bar-H
-
- (Q7-13)프로그래밍 언어 선호 (Africa/전체, 2021): heatmap
- (Q9-13)IDE (Africa/전체, 2021): bar-H
- (Q8)추천 프로그래밍 언어 (Africa/전체, 2021): bar-H
Machine Learning: Experience, Framework and Algorithms
- (Q15)Muchine Learning 경력 (Africa/전체, 2021): bar-H
- (Q16-18)Muchine Learning 플랫폼 (Africa/전체, 2021): bar-H
- (Q17-12)Muchine Learning 알고리즘 (Africa/전체, 2021): bar-H
- (Q18-7)computer vision Methods (Africa/전체, 2021): Heatmap
- (Q19-6)자연언어 처리방법 (Africa/전체, 2021): Heatmap
- (Q14-12)visualizations Library (Africa/전체, 2021): Heatmap
-
- (Q11)hardware platform (Africa/전체, 2021): bar-H
- (Q13)TPU 사용빈도 (Africa/전체, 2021): bar-H
- (Q12-6)특별한 하드웨어 (Africa/전체, 2021): Heatmap
- (Q27_A 12)온라인 플렛폼 (Africa/전체, 2021): bar-H
- (Q28)클라우드 플렛폼 (Africa/전체, 2021): bar-H
- (29_A, 5)클라우드 만들때 쓰는 기본 resource? (Africa/전체, 2021): bar-H
- (32_A, 12빅데이터 만들때 (Africa/전체, 2021): bar-H
- (Q33)가장많이 쓰는 big data 생성 프로그램 (Africa/전체, 2021): bar-H
-
- (Q20) 최근 고용주 (Africa/전체, 2021): bar-H
- (Q24)일할때 중요한 활동 (Africa/전체, 2021): Heatmap
- (Q25) 급여 피라미드 (Africa/전체, 2021): dual bar-H
-
- (Q40) data science 배우는 플랫폼 (Africa/전체, 2021): bar-H
- (Q42-12) 가장 좋아하는 DS Topics 미디어 소스 (Africa/전체, 2021): Heatmap
-
특정 연도를 넣지 않은 부분은 historical data
2. Import
2.1 dataFrame & visualization Module
1 | import numpy as np |
Numpy
dataframe
Pandas
dataframe
seaborn
Seaborn은 Metplotlib를 기본으로 생상테마와 통계용 차트 기능을 추가한 시각화 패키지
기본적인 시각화 기능은 Matplotlib, 통계는 Statsmodels에 의존한다.
Ref. seaborn tutorial/En
matplotlib
matplotlib.pyplot 모듈은 명령어 스타일로 동작하는 함수의 Library.
함수를 이용하여 그래프를 만들고, grid를 조정하고, Label도 꾸미는 등을 할 수 있다.
Ref. matplotlib.pyplot
2.2 plotly
1 |
|
Plotly
plotly Livrary 전체를 pio로 받아옴.
그 중에서
- px : plotly-express
- go : graph_objects
- ff : figure_factory
- px가 존재하기 이전 go로 생성하기 어려운 특정 유형의 플롯을 생성 할 수 있는 전용 함수가 있다.
를 받아 왔다.
- plotly에서 G를 그리는 방법은 2가지가 있는다.
- px : 템플릿을 통해 제작
- go : 그래프를 하나하나 설정하며 제작
- offline plotly
1 | import os |
- data input 하는 방법.
여러개의 csv file을 경로를 지정 해주어 한번에 넣어주는 code
1 | df17= pd.read_csv("/kaggle/input/kaggle-survey-2017/multipleChoiceResponses.csv", encoding="ISO-8859-1") |
연도 별로 dataFrame을 씌워서 csv file을 dfyy객체에 Loading해 준다.