kaggle :HorizontalBar (Q17)
kaggle dictation (03)
plotly.graph_objects as go: 를 이용한 bar graph
HorizontalBar plot /가로 막대 차트
0. data set
https://www.kaggle.com/miguelfzzz/the-typical-kaggle-data-scientist-in-2021
Subject : 어떤알고리즘을 선호 하는 지 알아보는 Horizontal bar
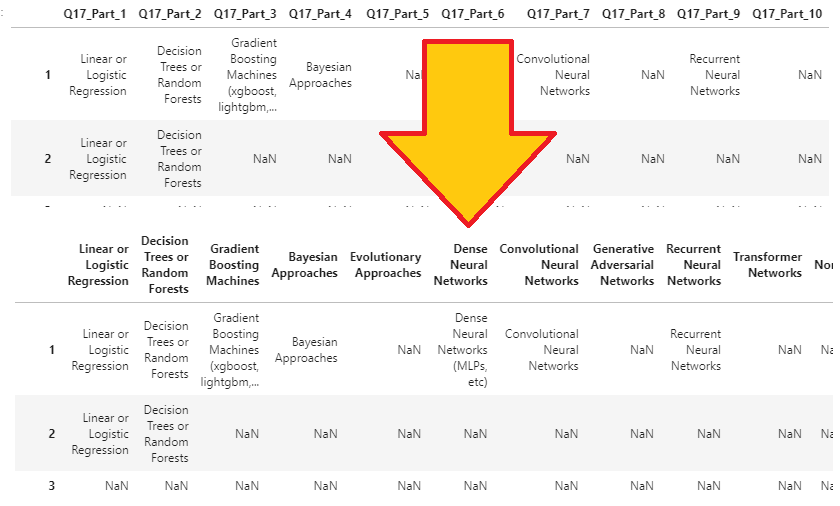
1. data 읽어오기
algorithms_cols에 data frame을 먼저 만들고 시작.
잘 모르겠지만 아마도 Q17이 붙은 data를 선택 하기 위한 code
algorithms_cols = [col for col in df if col.startswith(‘Q17’)]
col 1부터 df 끝까지
Q17로 시작하는지 확인하여 true일때만 데이터 가져오기
How to select dataframe columns that start with *** using pandas in python ?
1 | algorithms_cols = [col for col in df if col.startswith('Q17')] |
2. data Frame 만들어 주기
algorithms 에 data frame을 씌워서 표를 만들고, 이름을 다음과같이 바꿔줌.
1 |
|
3.표 설정.
1 | algorithms = ( |
- .count() :coulumn 수 세기
- .to_frame() : frame 생성
- .reset_index() : 원본과 상관없는 Index 생성
- .rename()
- columns의 이름을 지정 : ‘index’:’Algorithms’, 0:’Count’
- .sort_values()
- by=[‘Count’], ascending=False
- Count 기준으로 내림차순으로 정렬
3. percent 추가
1 | algorithms['percent'] = ((algorithms['Count'] / len(df))*100).round(2).astype(str) + '%' |
표에 ‘percent’를 추가
algorithms의 count에 df의 length로 나누고 *100을 하는 전형적인 % 나타내기
값자체에 %를 입력하여 나중에 %를 추가 입력하지 않아도 됨
소숫점 자리 2까지 반영(반올림).
type 자체를 String으로 하여 추가 계산은 불가능.
4. 색 지정
1 | colors = ['#033351',] * 12 |
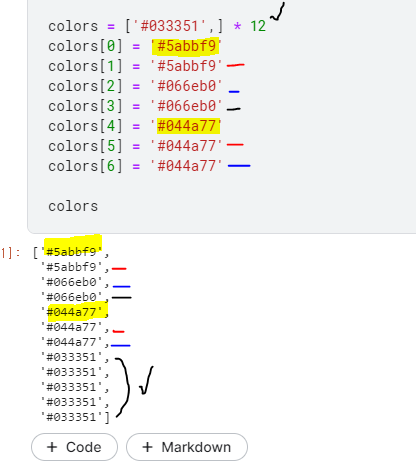
색 깊이는 12단계, 0~6까지는 정해주고 나머지 5개는 #033351을 default로 한 것을 알 수 있다.
5. bar Graph 만들기
1 | fig = go.Figure(go.Bar( |
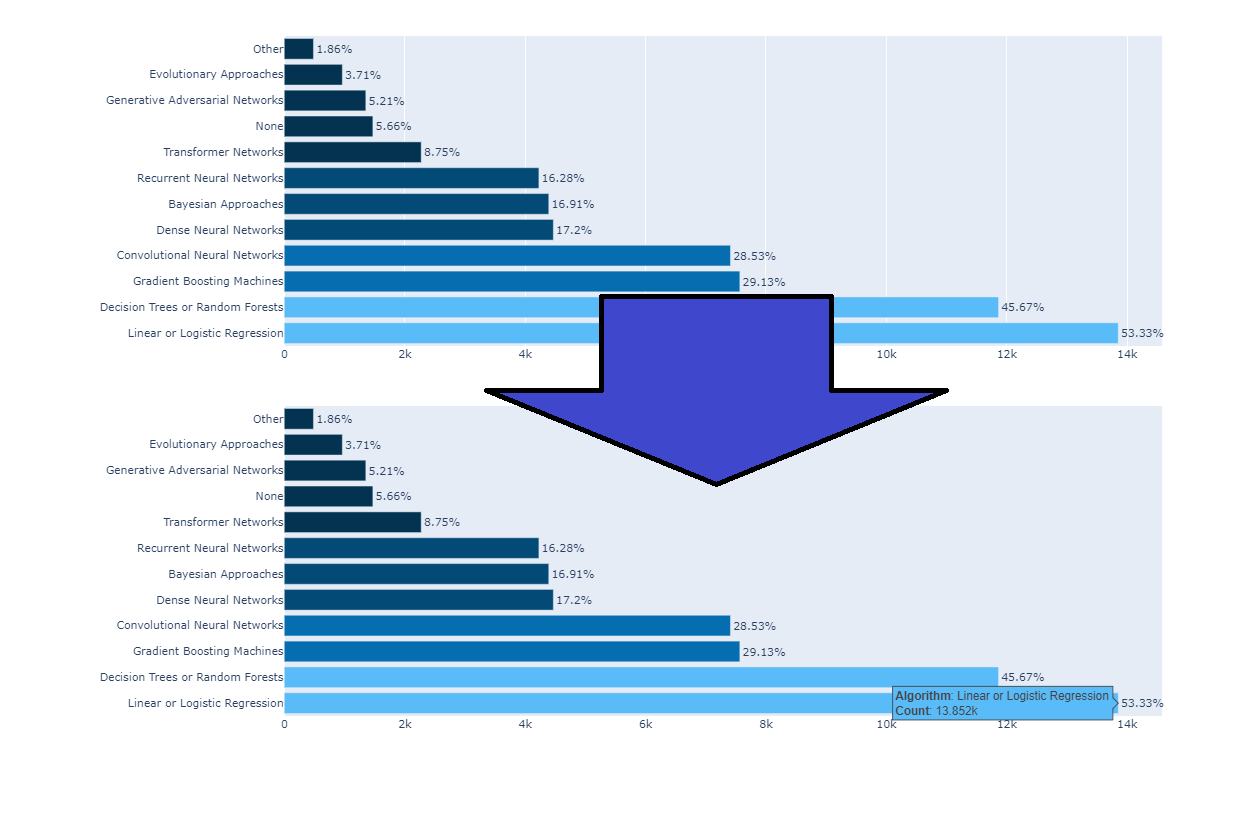
horizontal과 vertical Graph의 차이는 x, y axis를 바꾸어 주는 것과
orientation=’h’ 을 넣어 주는 것의 차이.
<orientation 없음>
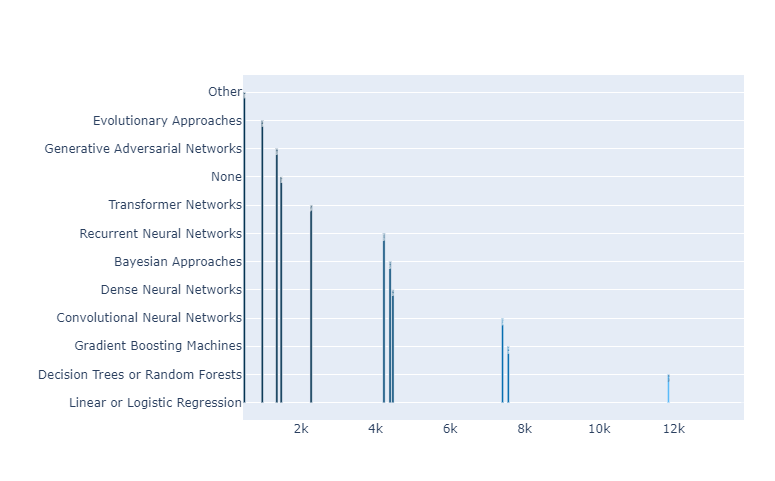
<orientation H 있음> 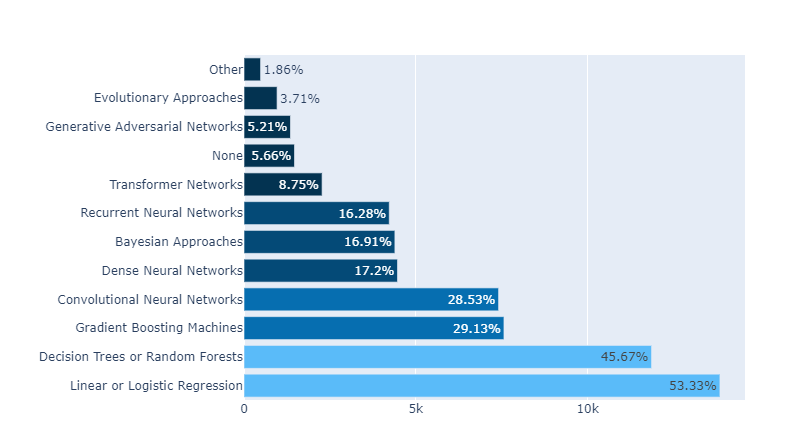
6. update_traces()
traces() 수정 : Trace에 대한 설정
1 | fig.update_traces(texttemplate='%{text}', |
- texttemplate : text type
- textposition : ‘outside’ _ 설정 해 주지 않은 경우 칸에 따라 적당히 들어감.
- cliponaxis = False : text가 칸이 작아서 짤리는 경우를 막아주는 기능 (off)
- hovertemplate :
- 마우스 On하면 (커서를 위에 대면) 나오는 Hovert에대한 설정.
- textfont_size : 폰트 size
7. Design
1 |
|
- Grid Delete
- update_layout
- showlegend=False,
- plot_bgcolor=’#F7F7F7’
- margin=dict(pad=20),
- paper_bgcolor=’#F7F7F7’,
- xaxis={‘showticklabels’: False},
- x 축 labels을 삭제.
- yaxis_title=None,
- xaxis_title=None, yaxis={‘categoryorder’:’total ascending’},
- y 축 title을 categoryorder
-
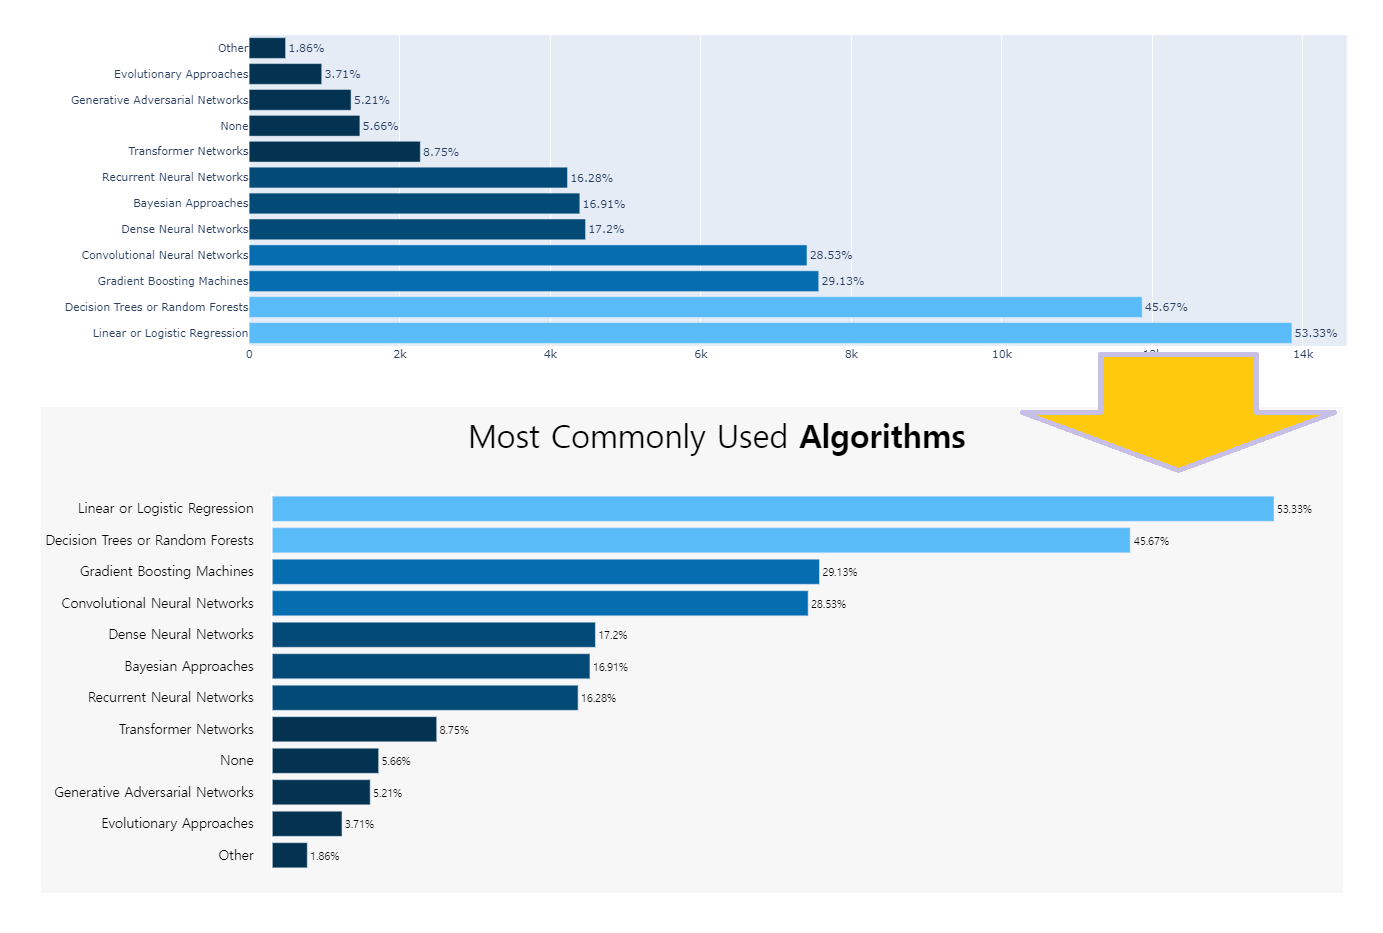
- Automatically Sorting Categories by Name or Total Value
- layout-xaxis-categoryorder
- title_text=”Most Commonly Used Algorithms“,
- title_x=0.5,
- font=dict(family=”Hiragino Kaku Gothic Pro, sans-serif”, size=15, color=’#000000’),
title_font_size=35)
이미 앞서서 충분히 설명 했기 때문에 본 posting에서 설명되지 않은 부분은
basic bar Graph 에서 확인
8. Annotation
1 | fig.add_annotation(dict(font=dict(size=14), |
kaggle :HorizontalBar (Q17)
https://yoonhwa-p.github.io/2021/11/09/kgg/Kgg_plotly_Horizontal/
install_url to use ShareThis. Please set it in _config.yml.