#How popular is kaggle in South Korea?
data 정제하기 1 2 3 4 5 6 7 8 9 10 11 12 13 14 15 16 17 18 19 20 21 22 23 24 df21_Ko = df21[df21['Q3' ] == 'South Korea' ] df21_Wo = df21[~(df21['Q3' ] == 'South Korea' )] df21['region' ]=["Korea" if x == 'South Korea' else "World" for x in df21['Q3' ]] df21['region' ].value_counts() df20_Ko = df20[df20['Q3' ] == 'South Korea' ] df20_Wo = df20[~(df20['Q3' ] == 'South Korea' )] df20['region' ]=["Korea" if x == 'South Korea' else "World" for x in df20['Q3' ]] df20['region' ].value_counts() df19_Ko = df19[df19['Q3' ] == 'South Korea' ] df19_Wo = df19[~(df19['Q3' ] == 'South Korea' )] df19['region' ]=["Korea" if x == 'South Korea' else "World" for x in df19['Q3' ]] df19['region' ].value_counts() df18_Ko = df18[df18['Q3' ] == 'South Korea' ] df18_Wo = df18[~(df18['Q3' ] == 'South Korea' )] df18['region' ]=["Korea" if x == 'South Korea' else "World" for x in df18['Q3' ]] df18['region' ].value_counts() df17_Ko = df17[df17['Country' ] == 'South Korea' ] df17_Wo = df17[~(df17['Country' ] == 'South Korea' )] df17['region' ]=["Korea" if x == 'South Korea' else "World" for x in df17['Country' ]] df17['region' ].value_counts()
<<<<<<< HEAD
World 25615
World 19847
World 19536
World 23672
World 16522
2021
World 25615
Korea 359
Name: region, dtype: int64
2020
World 19847
Korea 190
Name: region, dtype: int64
2019
World 19536
Korea 182
Name: region, dtype: int64
2018
World 23672
Korea 188
Name: region, dtype: int64
2017
World 16522
Korea 194
Name: region, dtype: int64
trouble shooting data 정제를 하다 보니 전체 data에서 korea가 1% 밖에 되지 않아 data set을 더 추가 하기로 했다.
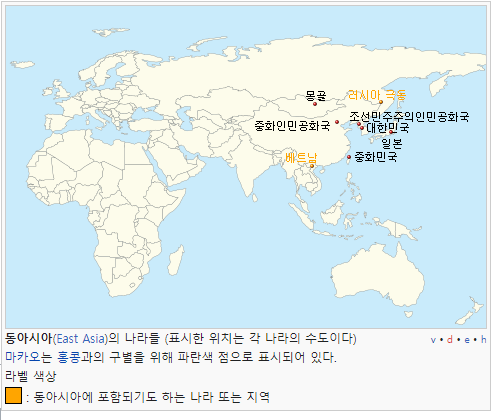
##동아시아
Ref. East Asia
동아시아
East Asia에는 대한민국, 일본, 중국, 타이완, 몽골, 북조선 총 6개의 국가가 속해 있다.
알 수 없지만, 18년도엔 타이완이 없다.
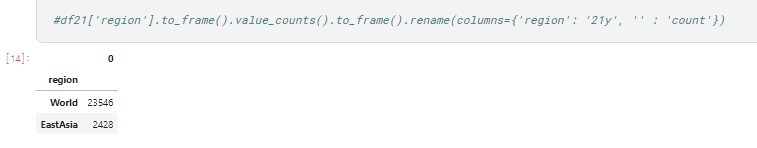
1 2 3 4 5 6 7 8 9 10 11 12 13 14 15 16 17 18 19 20 21 22 23 24 25 26 27 28 29 30 31 32 33 34 EastAsia17 = ['China' ,"People 's Republic of China" , 'Taiwan' , 'South Korea' , 'Japan' ] EastAsia18= ['China' , 'South Korea' , 'Japan' , 'Republic of Korea' ] EastAsia19 = ['China' ,'Taiwan' , 'South Korea' , 'Japan' , 'Republic of Korea' ] EastAsia20 = ['China' ,'Taiwan' , 'South Korea' ,'Republic of Korea' , 'Japan' ] EastAsia21 = ['China' ,'Taiwan' , 'South Korea' , 'Japan' ] EastAsia = ['Republic of Korea' ,'China' ,'Taiwan' , 'South Korea' , 'Japan' , "People 's Republic of China" ] df21_Ea = df21[df21['Q3' ].isin(EastAsia)] df21_Wo = df21[~df21['Q3' ].isin(EastAsia )] df21['region' ]=["EastAsia" if x in EastAsia else "World" for x in df21['Q3' ]] df20_Ea = df20[df20['Q3' ].isin(EastAsia)] df20_Wo = df20[~df20['Q3' ].isin(EastAsia )] df20['region' ]=["EastAsia" if x in EastAsia else "World" for x in df20['Q3' ]] df19_Ea = df19[df19['Q3' ].isin(EastAsia)] df19_Wo = df19[~df19['Q3' ].isin(EastAsia )] df19['region' ]=["EastAsia" if x in EastAsia else "World" for x in df19['Q3' ]] df18_Ea = df18[df18['Q3' ].isin(EastAsia)] df18_Wo = df18[~df18['Q3' ].isin(EastAsia )] df18['region' ]=["EastAsia" if x in EastAsia else "World" for x in df18['Q3' ]] df17_Ea = df17[df17['Country' ].isin(EastAsia)] df17_Wo = df17[~df17['Country' ].isin(EastAsia )] df17['region' ]=["EastAsia" if x in EastAsia else "World" for x in df17['Country' ]]
21년도 를 .value_counts()로 뽑아 냈다.
1%대는 아니지만, 이제 10%대 data를 뽑아 냈다.
이것이 어떤 의미가 있을지 모르겠지만, 일단 주말동안 이 data로 궁금한 것을 Graph로 만들어 보자.
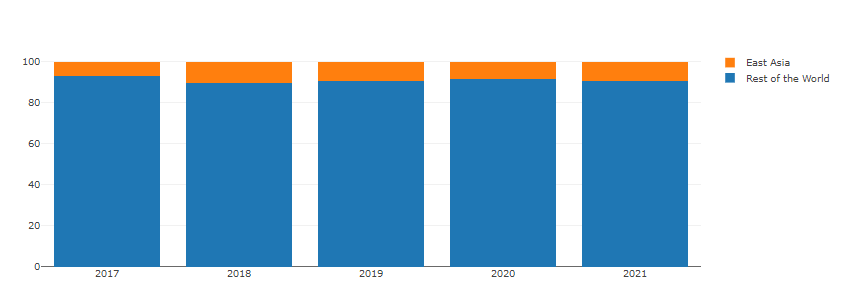
1 2 3 4 5 6 7 8 9 10 11 12 13 14 15 16 17 18 19 20 21 22 23 24 25 26 27 28 29 30 31 32 33 34 35 36 37 38 39 40 Ea21 = len (df21_Ea) Wo21 = len (df21) - len (df21_Ea) Ea20 = len (df20_Ea) Wo20 = len (df20) - len (df20_Ea) Ea19 = len (df19_Ea) Wo19 = len (df19) - len (df19_Ea) Ea18 = len (df18_Ea) Wo18 = len (df18) - len (df18_Ea) Ea17 = len (df17_Ea) Wo17 = len (df17) - len (df17_Ea) def percent (a, b ): result =a/(a+b)*100 return result def percentR (b, a ): result =a/(a+b)*100 return result country = ['East Asia' , 'Rest of the World' ] years = ['2017' , '2018' , '2019' , '2020' , '2021' ] fig = go.Figure(data=[ go.Bar(name='Rest of the World' , x=years, y=[percentR(Ea17, Wo17), percentR(Ea18, Wo18), percentR(Ea19, Wo19), percentR(Ea20, Wo20), percentR(Ea21, Wo21)]), go.Bar(name='East Asia' , x=years, y=[percent(Ea17, Wo17), percent(Ea18, Wo18), percent(Ea19, Wo19), percent(Ea20, Wo20), percent(Ea21, Wo21)]) ]) fig.update_layout(barmode='stack' ) fig.show()
일단, plot은 뽑아 보았는데 이래도 되나 싶다 ^^ 하하
노동력을 더해서 대륙 별로 뽑던지 해야겠다 ㅂㄷㅂㄷ
072bc76c34c0f369e5fe7e814291408da6a83ffc