1
2
3
4
5
6
7
8
9
10
11
12
13
14
15
16
17
18
19
20
21
22
23
24
25
26
27
28
29
|
df21Age_Ea = df21_Ea.loc[:,['Q3','Q1']].reset_index().rename(columns={'Q3':'East_Asia', 'Q1':'2021'}).fillna('etc')
df20Age_Ea = df20_Ea.loc[:,['Q3','Q1']].reset_index().rename(columns={'Q3':'East_Asia', 'Q1':'2020'}).fillna('etc')
df19Age_Ea = df19_Ea.loc[:,['Q3','Q1']].reset_index().rename(columns={'Q3':'East_Asia', 'Q1':'2019'}).fillna('etc')
df18Age_Ea = df18_Ea.loc[:,['Q3','Q2']].reset_index().rename(columns={'Q3':'East_Asia', 'Q2':'2018'}).fillna('etc')
df17Age_Ea = df17_Ea.loc[:,['Country','Age']].reset_index().rename(columns={'Country':'East_Asia', 'Age':'2017'}).fillna('etc')
dfAge21_percent =df21Age_Ea.groupby(['East_Asia','2021']).size().reset_index().rename(columns = {0:"Count"})
dfAge21_percent['percent'] =((dfAge21_percent['Count'] / len(df21Age_Ea))*100).round(2)
dfAge21_percent['percent_str'] =((dfAge21_percent['Count'] / len(df21Age_Ea))*100).round(2).astype(str) + '%'
dfAge21_percent
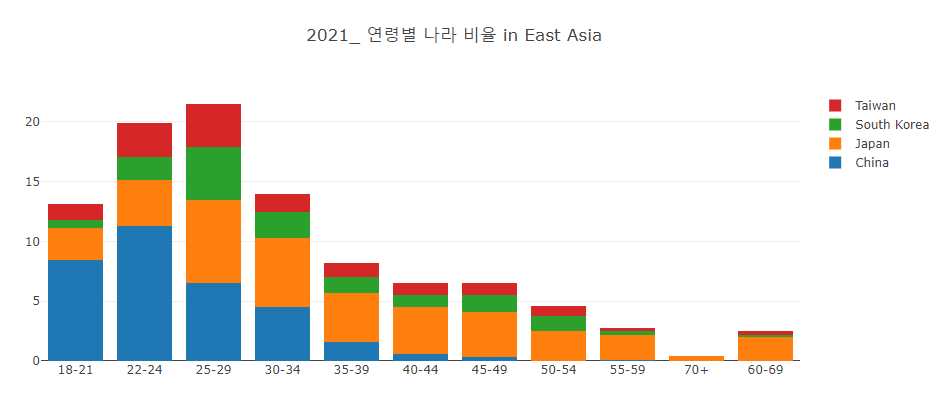
fig = go.Figure()
for country, group in dfAge21_percent.groupby('East_Asia'):
fig.add_trace(go.Bar(
x = group['2021'], y = group['percent'], name = country, text=group['percent_str']
))
fig.update_layout(barmode="stack",
plot_bgcolor = "white",
title='2021_ 연령별 나라 비율 in East Asia')
fig.show()
|