kaggle :Plotly_Treemap (Q8)

kaggle dictation (01)


plotly.graph_objects as go : 를 이용한 Treemap

  • 많은 계층 구조 데이트를 표현할때 적합.
  • Ben Shneiderman에 의해 1990년도부터 출발
  • Treemap은 크기(count) 순서로 %에따라 공간을 차지하는 사각형으로 표현됨.
  • 계층에서 동일한 수준에 속하는 각 사각형 집합은 데이터 테이블의 표현식 또는 컬럼을 표현.
  • 계층에서 동일한 수준의 개별 사각형은 컬럼의 Index


언제 사용하면 좋을까

- 많은 범주간의 부분과 전체를 시각화 하고 싶을때
- 범주 간의 정확한 비교 대신 큰 특징을 나타내고 싶을때
- 데이터가 계층을 이루고 있을때


사용한 Library

1
2
3
4
5
6
7
8
import pandas as pd
import numpy as np
import seaborn as sns
import plotly.express as px
import plotly.graph_objects as go

import warnings
warnings.filterwarnings('ignore')
사실 이 부분에서 seaborn을 사용 했는지 잘 모르겠음.
github에서 plotly가 동적 Livrary라 자꾸 오류가남.


data import

data 원문
data import 방법
data는 Kaggle의 the-typical-kaggle-data-scientist-in-2021 data를 이용하였음.

data 불러오기/합치기

data를 표현 해 주기 위해 컴퓨터가 읽을 수 있는 형태로 가공.
1
2
df = pd.read_csv('../input/kaggle-survey-2021/kaggle_survey_2021_responses.csv')
df = df.iloc[1:, :]

df : data frame에 file 연동.
df.iloc[1:, :] : 1행부터 끝까지 건너뛰기 없이 선택

행번호(row number)로 선택하는 방법 (.iloc)
label이나 조건표현으로 선택하는 방법 (.loc)

Ref. loc, iloc을 이용한 행 선택


data encoding (Feature Engineering)

사실 이 부분이 feature Engineering에 해당하는 부분인지 잘 모르겠다.
이 부분은 data를 computer로 자동화하여 계산, 동적 그래프를 만들기 위한 부분.

###Feature Engineering
####data frame 설정

1
2
3
4
5
6
7
8
9
10
11
12
recommend_leng = ( df['Q8']
.value_counts()
.to_frame()
.reset_index()
.rename(columns={'index':'Lenguage', 'Q8':'Count'})
.sort_values(by=['Count'], ascending=False)
)

df['Q8'].head()

recommend_leng

recommend_leng


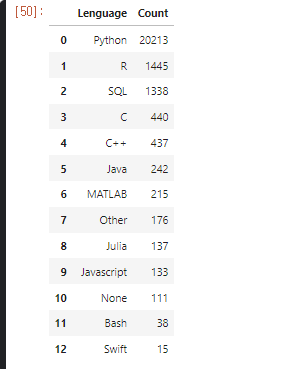
dataframe[Q8] : data를 가공하여 분석 할 예정

  • pd.value_counts()
    • Q8의 data counting, 중복된 data 를 counting 하여 수를 나타냄.
  • pd.frame()
    • dataframe으로 표의 형태를 잡아준다.
  • pd.reset_Index()
    • Q8의 Index reset, 원본 data에는 영향을 주지 않으면서 새로운 Index 생성
    • Reset_parameter/Ko
  • pd.rename()
    • columns에 Index를 붙여 호출 하기 위해 이름을 바꿔줌
    • index는 Lenguage로, count는 Q8로
  • pd.sort_values()
    • count 값으로 정렬
    • by=[‘Count’], ascending = false
    • by에 option 기준, (오름차순 = F )= 내림차순으로 정렬


앞으로 사용 할 색상을 미리 지정

  • 한 눈에 보기 편함.
1
2
3
4
5
6
colors = ['#033351',] * 13
colors[0] = '#5abbf9'
colors[1] = '#066eb0'
colors[2] = '#044a77'
colors[3] = '#043e64'
colors[4] = '#043e64'

아직 잘 모르겠는 부분은 왜 colors = [‘#NNNNNN’, ] 이 부분과 *13 이부분


Treemap 생성

1
2
3
4
5
6
fig = go.Figure(go.Treemap(
labels = recommend_leng['Lenguage'],
values = recommend_leng['Count'],
parents = ['']*recommend_leng.shape[0],
textinfo = "percent root+label+value+text",
))

fig 생성

  • import plotly.graph_objects as go
    plotly의 graph_objects 를 이용하여 객체 생성.

Treemap의 parameter

  • labels : values 이름
  • values : 값
  • parents : ???
  • textinfo = 표시형식

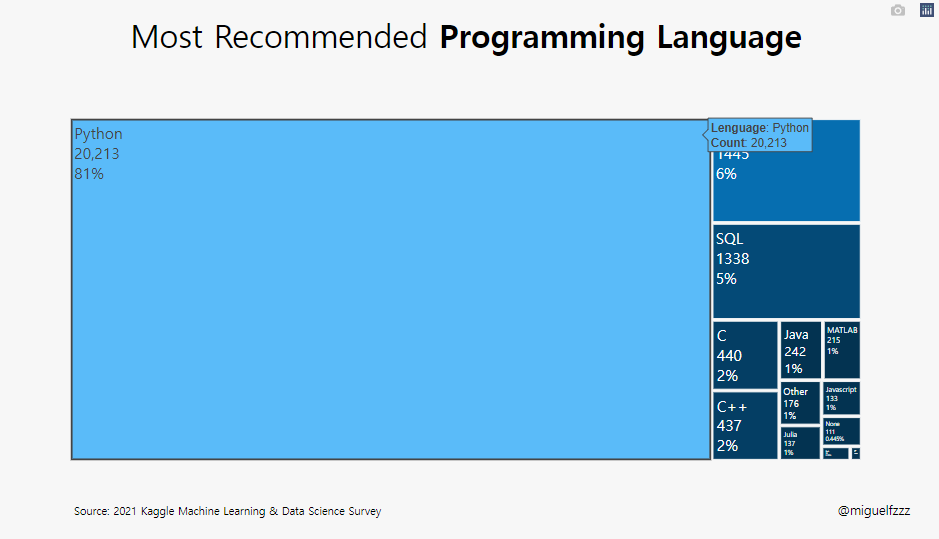
fig.update_traces(hovertemplate)

1
2
fig.update_traces(hovertemplate='<b>Lenguage</b>: %{label}<br><extra></extra>'+
'<b>Count</b>: %{value}')

hovertemplate


  • fig.update_traces()
  • 그래프 위에 캡션 다는 기능
    • Perform a property update operation on all traces that satisfy the specified selection criteria
    • 지정된 선택 기준을 충족하는 모든 추적에 대해 속성 업데이트 작업 수행 (?? 전혀 모르겠군 !)

  • hoverinfo : 마우스 오버시 나타나는 추적정보
  • hovertemplate : 커서를 가까이 대면 나오는 창을 렌더링하는데 사용되는 Temp
    • 변수 : %{variable} (변수의 형식을 지정)
      • 숫자 : %{d3-format}
      • price : %{yL$.2f}


fig.update_layout()

fig의 layout을 설정.

hoverTemp까지 설정된 treemap.


Before_layout


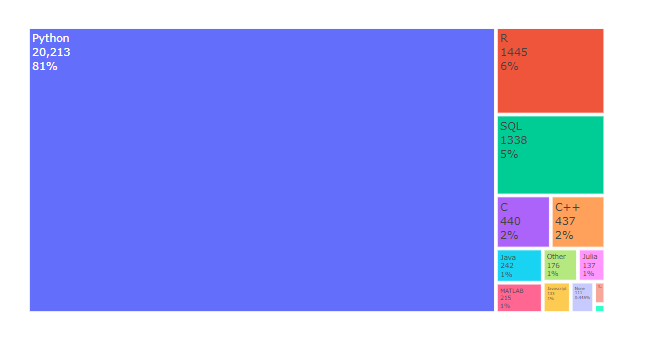
fig.update_layout()을 사용하여 layout을 변경 해 보자.


After_layout


1
2
3
4
5
6
7
8
9
10
11
12
13
14
fig.update_layout(showlegend=False, 
treemapcolorway = colors,
margin=dict(pad=20),
paper_bgcolor='#F7F7F7',
plot_bgcolor='#F7F7F7',
height=600,
yaxis={'showticklabels': False},
yaxis_title=None,
xaxis_title=None,
title_text="Most Recommended <b>Programming Language</b>",
title_x=0.5,
title_y=0.95,
font=dict(family="Hiragino Kaku Gothic Pro, sans-serif", size=17, color='#000000'),
title_font_size=35)
  • showlegend = False
    • 래전드를 보여줄지 : 안보여줌
  • treemapcolorway = colors
    • 위에서 정의 해 준 colors가 13개였는데 여기 계층도 13개임
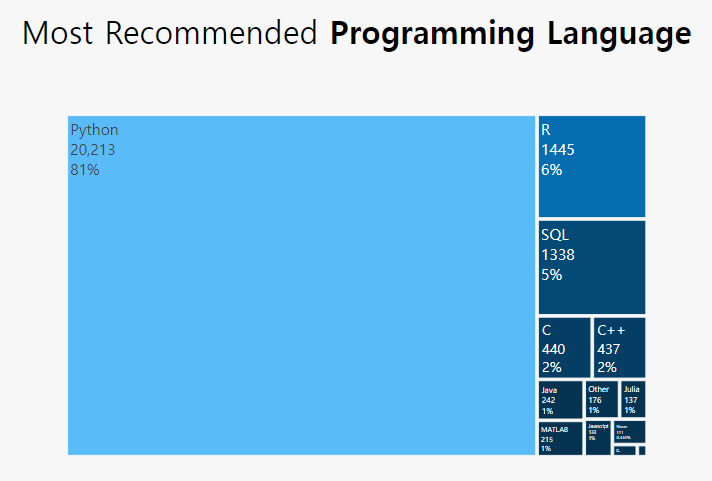
      • 아마도 light 부터 deep으로 색이 정해지는듯.
  • margin=dict(pad=20)
    -dic에는 여러가지가 올 수 있는데 여기서는 dict(pad)를 사용
    • padding을 설정, 축과 그래프 사이의 패딩을 px 단위로 설정
    • Sets the amount of padding (in px) between the plotting area and the axis lines
    • layout-margin
  • paper_bgcolor=’#F7F7F7’
    • 배경색 설정

paper_bgcolor

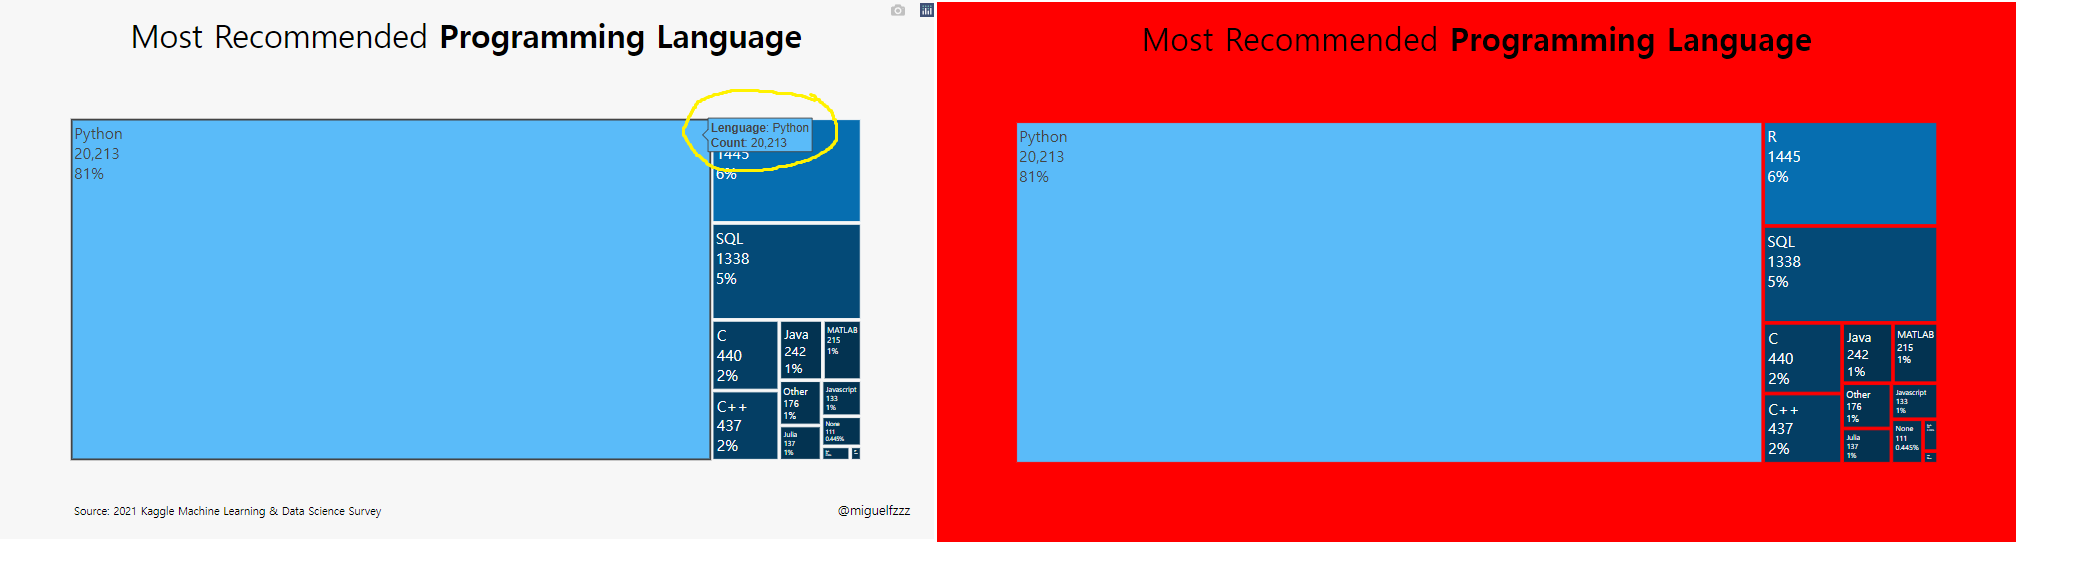
  • plot_bgcolor=’#F7F7F7’
    • 설정 바꿔 보았으나 안보임
  • height=600
    • plot size 설정
  • yaxis={‘showticklabels’: False}
    • y축의 showticklabels 설정 : 안함
  • yaxis_title=None, xaxis_title=None
    • y축 제목, x축 제목 설정 : 없음
  • title_text=”Most Recommended Programming Language
    • 제목 달기 <b> code는 bolde tag인듯.
  • title_x=0.5, title_y=0.95,
    • 제목의 위치 (상단 고정)
  • font=dict(family=”Hiragino Kaku Gothic Pro, sans-serif”, size=17, color=’#000000’),
                title_font_size=35)
    
    • title의 font 설정 (Default: “”Open Sans”, verdana, arial, sans-serif”)
    • font 설정
    • family, color, size 설정 가능, title_fond도 함께 설정 가능 해 보임.


fig Information 추가

fig.add_annotation() _1

플롯에 메모를 남길 수 있는것. 코멘트나 copy-Right 같은걸 남기는듯

-[plotly-annotation/ko.] (https://soohee410.github.io/plotly_annotation)

1
2
3
4
5
6
7
8
fig.add_annotation(dict(font=dict(size=14),
x=0.96,
y=-0.14,
showarrow=False,
text="@miguelfzzz",
xanchor='left',
xref="paper",
yref="paper"))

dict = dictionary

A list or tuple of dicts of string/value properties where:
The ‘type’ property specifies the trace type

  • 여기서 dict는 fig객체 즉 plotly.graph_objects.Figure 에서 상응하는 정보(font, size등) 변수를 가져와 대응 시켜 주는 역할을 한다.

plot 아래에 보면 “@miguelfzzz”이라는 글자가 보이는데 이것을 설정 한 것.

  • showarrow=False,
    • 화살표등을 남길 수 있는데 이 Graph에선 false
  • xref=”paper”, yref=”paper”
    • 어느 부분 (plot or paper)에 표시 할 것인지

나머지는 말 안해도 이제는 알 수 있기 때문에 생략.

fig.add_annotation() _2

1
2
3
4
5
6
7
8
fig.add_annotation(dict(font=dict(size=12),
x=0.01,
y=-0.14,
showarrow=False,
text="Source: 2021 Kaggle Machine Learning & Data Science Survey",
xanchor='left',
xref="paper",
yref="paper"))


fig.show() 내보내기

1
fig.show()

fig.show()로 마무리 해 주면 된다.

이건 java의 return과 같은 느낌인듯.

Plotly Treemap/en.

layout/en.

kaggle study


Sumarry

kaggle_Comp


  1. Demographics & Geographics
    • (Q1) Age-bar
    • (Q2) Gender-pie
    • (Q3)countries-scatter+line
  2. Education & Occupation
    • (Q4) Age-bar_h
    • (Q5) Role-bar_h
    • (Q20) Industry-bar_h
  3. knowledge & skills
    • (Q6) Experience : 52% 넘는 응답이 3년이상 코딩과 프로그래밍을 했다. -bar vertical (위)
    • (Q17) Algorithms : Linear or Logistic Regression 55% 과 Decision tree or Random Forests, respectively 66% 사용. - bar horizon (옆)
    • (Q7) Languages : python 84%, SQL 41% 사용 -bar horizon
    • (Q8) Recommend_Leng: programming에 추천하는 언어는 81%가 python -Treemap
    • (Q9) F_EG /w Q7 가장 많이 쓰는 IDE : jupyter Notebook26.2%, VSCODE 13.92% - bar horizon
  4. Platforms & Media4. Platforms & Media
    • (Q11) Platform: 많이 쓰는 컴퓨터 플랫폼은 랩탑이 66% -Scatter + line
    • (Q27_A)cloud_platform: 아마존 14%, 구글클라우드 12%, 마쏘 아줠 9% - bar horizon
    • (Q40) courses: DS들이 많이 쓰는 course 플랫폼 Coursera 20, Kaggle 18%-Treemap
    • (Q42) media : DS topic report를 위해 많이 쓰는 media는 kaggle 44%, youTube 40%, blog 31% -scatter + line
    • Takeaways : typical Kaggle DS in 2021 :HTML picture n line n text
1
2
3
4
5
6
7
8
9
10
11
12
13
14
15
16
17
18


# This Python 3 environment, PKG Load
import numpy as np # linear algebra
import pandas as pd # data processing, CSV file I/O (e.g. pd.read_csv)

# Input data files : "../input/"
# Running : Shift+Enter

import os
for dirname, _, filenames in os.walk('/kaggle/input'):
for filename in filenames:
print(os.path.join(dirname, filename))

# ~ 20GB ,/kaggle/temp/


/kaggle/input/kaggle-survey-2021/kaggle_survey_2021_responses.csv
/kaggle/input/kaggle-survey-2021/supplementary_data/kaggle_survey_2021_methodology.pdf
/kaggle/input/kaggle-survey-2021/supplementary_data/kaggle_survey_2021_answer_choices.pdf
The Typical Kaggle Data Scientist in 2021


Remade By @YoonHwa-P

HTML code는 Markdown 형식으로 넣을 수 있게 해 준다.

scr : 구글 팟케스트에서 바로 연결하여 사용.

1
2
3
4
5
6
7
8
9
10
11
import pandas as pd
import numpy as np
import seaborn as sns
import plotly.express as px
import plotly.graph_objects as go

import warnings
warnings.filterwarnings('ignore')


시각화, 계산을 위해 Pandas, Numpy, seaborn을 이용 할 것이고, 동적보드를 만들기 위해 plotly를 이용 하였다.

plotly 중에서 Express와 Graph_objects를 가져와서 사용 할 예정인듯.

plotly-express

The Plotly Express API in general offers the following features:

Every PX function returns a** plotly.graph_objects.Figure object**, so you can edit it using all the same methods like update_layout and add_trace.

input으로 Express를 사용 한다면 Graph_objects가 동적 plotly 를 만드는 것 같다. : update 하거나 trace를 가능 하게 하는듯.

실제 필사할 data에서는 어떤 data가 있는지 확인 해 보지 않았지만,
나는 배우는 입장이니 어떤 data가 있는지, 어떤 head가 있는지 확인 해 보도록 한다.

맨 위에 가보면 Note가 생성 될때

/kaggle/input/kaggle-survey-2021/kaggle_survey_2021_responses.csv
/kaggle/input/kaggle-survey-2021/supplementary_data/kaggle_survey_2021_methodology.pdf
/kaggle/input/kaggle-survey-2021/supplementary_data/kaggle_survey_2021_answer_choices.pdf

위와같은 file dir을 알려준다. 이제, pandas로 이 files를 로딩 시켜 주면된다.

Ref. Kaggle활용.국문

1
2
3
4
5
6
7
8
df = pd.read_csv("../input/kaggle-survey-2021/kaggle_survey_2021_responses.csv")
df = df.iloc[1:, :] #이건 왜 선택 해 놓은 것일까요?
df.head()

df.info()


<class 'pandas.core.frame.DataFrame'>
RangeIndex: 25973 entries, 1 to 25973
Columns: 369 entries, Time from Start to Finish (seconds) to Q38_B_OTHER
dtypes: object(369)
memory usage: 73.1+ MB

df에 pd.read_csv로 csv file을 읽어 옵니다.

역시 pd인 df객체에 iloc을 이용하여 [ 1행부터 : , : ] iloc를 선택 해 놓았다.

  1. 행번호(row number)로 선택하는 방법 (.iloc)
  2. label이나 조건표현으로 선택하는 방법 (.loc)

Ref. loc를 이용한 행 선택


0. Introduction

This notebook will explore the fascinating results obtained from the survey conducted by Kaggle in September 2021. Over 25,000 data scientists and ML engineers participated, providing information on their backgrounds and experience in their occupations.

To increase readability, this report is divided into four sections:

  1. Demographics & Geographics
  2. Education & Occupation
  3. Knowledge & Skills
  4. Platforms & Media


Introduction
이 노트북은 25000 data scientist들과 ML Engineer들의 kaggle에서 경험 한것을 조사한 data를 매력적인 결과로 탐험 하게 될 것이다.
(대충)

; Introduction 에서 이 notebook의 성격, data의 간간한 정보, 목차 등을 설명.


모든 글은 Markdown을 이용한 css 로 작성 된 것 같다.


혹시,
css
에 대하여 더 알아보고 싶으면, 이 문서를 참조 하자.


Pandas_Series

#Pandas에서 series 자료구조

series는 1차원 배열같은 자료 구조를 말한다.

아래 code는 python pandas의 parameter 값이다.

1
2
3

def __init__(data=None, index=None, dtype=None, name=None,
copy=False, fastpath=False)

series의 parameter는 data, index, dtype, name, copy, fastpath로 나뉘어져 있는데
name의 경우는 이름 인 것 같고 기본적으로 Index와 value라는 parameter를 많이 이용 하는 듯 하다.

  • Index : 배열의 이름
  • value : 값

python의 dictionalry와 거의 유사 한 것 같다.

(다음에 찾아보자 오늘은 벅참.)

series의 dtype에는 str, numpy.dtype, or ExtensionDtype, optional Data type 을
담을 수 있는데 이는 자동으로 값이 입력 되는 것같다.

series 객체를 생성 할 때 value와 Index를 직접 지정 해 줄 수 있다.

1
2
3
4
import pandas as pd
sr = pd.Series([24000, 20000, 1000, 5000],
index=["피자", "치킨", "콜라", "생맥"])
print(sr)

구글 코랩에서 작업 하고 있는데,
아래에 보면 series 객체의 parameter에대한 팝업이 나와 공부 하기 참 편하게 해 준다.

def init(data=None, index=None, dtype=None, name=None, copy=False, fastpath=False)
One-dimensional ndarray with axis labels (including time series).

Labels need not be unique but must be a hashable type. The object supports both integer- and label-based indexing and provides a host of methods for performing operations involving the index. Statistical methods from ndarray have been overridden to automatically exclude missing data
(currently represented as NaN).
Operations between Series (+, -, /, *, **) align values based on their associated index values– they need not be the same length. The result index will be the sorted union of the two indexes.


Parameters

data : array-like, Iterable, dict, or scalar value

Contains data stored in Series.


index : array-like or Index (1d)

Values must be hashable and have the same length as data.

Non-unique index values are allowed. Will default to RangeIndex (0, 1, 2, …, n)
if not provided. If both a dict and index sequence are used, the index will
override the keys found in the dict.


dtype : str, numpy.dtype, or ExtensionDtype, optional

Data type for the output Series.

If not specified, this will be inferred from data.

See the user guide <basics.dtypes> for more usages.


name : str, optional


The name to give to the Series.


copy : bool, default False

Copy input data.

type

  • list []
  • tuple ()
  • set {}
  • dict {Key:value}

series

pandas

Pandas_panel

#pandas에서 panel 자료구조.

Pandas_DataFrame

#pandas에서 dataFrame 자료구조.

dataFrame은 표와 같은 스프레드 시트 형식의 자료 구조이다.

2차원 배열 또는 리스트, data table 전체를 포함하는 object라고 볼수 있음.

여러개의 column이 있고, 각 컬럼은 숫자, 문자열, boolean type을 담을 수 있다.

dataFrame은 Rew, column에대한 Index 이렇게 2가지 변수를 담고 있는데 matrix라고 할 수 있다.


pd.dataframe()

1
2
3
4
5
6
7
import pandas as pd
values = [['rose', 'tulip', 'Liry'], [4, 5, 6], ['red', 'blue', 'green']]
index = ['flower', 'Number', 'color']
columns = [1, 2, 3]

df = pd.DataFrame(values, index=index, columns=columns)
print(df)

df 는 data frame의 준말.

       1     2     3
flower rose  tulip Liry
Number 4     5     6
color  red   blue  green

Index와 column 의 dtype은 object이다.

데이터프레임은 리스트(List), 시리즈(Series), 딕셔너리(dict), Numpy의 ndarrays,
또 다른 데이터프레임으로 생성할 수 있습니다.

Ref.

DataFrame

Index

GitHub Index
made By @YoonHwa-P


Python

DBS


올려야 하는 Posting List

  • 의사결정트리, Regression
  • seaborn
  • matplotlib

수정 해야 할것도 넘넘 많다.
일단 이번 주 주말에는 Kaggle 먼저 (Team project 닌까.)

  • * : 수정중
1
2
3
<hr style="dashed 10px pink;">
<hr align="center" style="border: solid 10px #304A84; width: 50%;">
<span style="font-size:150%; color: Red;"> * </span>

※ 참고 할 Github

ㅁ https://github.com/dschloe/R_edu

ㅁ https://github.com/JunghoGIT

ㅁ https://github.com/kimgoden/JAVA01

ㅁ https://github.com/WDWDWWDff/Red

ㅁ https://github.com/OliverKang

ㅁ https://github.com/hanbeen1992

ㅁ https://github.com/kjw1390

Kaggle Note 사용하기

google colab에서 실행되지 않는

google colab에서 version 오류로 실행 되지 않는 것들이 있다고 한다.
따라서 이때 Kaggle data를 이용 할 예정이면 Kaggle Note를 사용해 보는 것은 어떨까?

kaggle_addNote

‘+ Create’ 표시를 누른다.

- New NoteBook
- New dataSet

탭이 나온다.

New NoteBook을 선택하여 이용해 보자.


아래와 같은 코드가 나오게 된다.

1
2
3
4
5
6
7
8
9
10
11
12
13
14
15
16
17
18
19
20
21
# This Python 3 environment comes with many helpful analytics libraries installed
# It is defined by the kaggle/python Docker image: https://github.com/kaggle/docker-python
# For example, here's several helpful packages to load

import numpy as np # linear algebra
import pandas as pd # data processing, CSV file I/O (e.g. pd.read_csv)

# Input data files are available in the read-only "../input/" directory
# For example, running this (by clicking run or pressing Shift+Enter) will list all files under the input directory

import os
for dirname, _, filenames in os.walk('/kaggle/input'):
for filename in filenames:
print(os.path.join(dirname, filename))

# You can write up to 20GB to the current directory (/kaggle/working/) that gets preserved as output when you create a version using "Save & Run All"
# You can also write temporary files to /kaggle/temp/, but they won't be saved outside of the current session


이것을 유지 한채 아래에 code 연습을 하면 되는 것 같다.

21.11.05_

python_Tuple

Open In Colab

Tuple

Tuple은 List에비해 메모리 사용 효율이 좋지만, 정보 수정이 어렵다.

splicing 기능, +, * 의 연산은 가능하다.

1

Dictionary

1

If 조건문

1

for 반복문

1

python_List

google Colaboratory 를 이용한 실습

Open In Colab

Intro_ print와 주석처리

  • print Out
1
print("Hello, World !!")
Hello, World !!

이제 우리는 모든 것을 나타 낼 수 있습니다.

  • 주석처리
1
2
3
4
5
6
7
# 한 줄로 주석 처리 하는 방법 
"""
여러줄은 이렇게
print("Hello, World??")
"""

print("Hello, World!!") #주석 처리한 부분은 안나오지
Hello, World!!

변수의 종류

  • int : 정수
  • float : 실수
  • bool : 참/거짓
  • none : null
  • String : 문자

이전에 배웠던 JAVA와는 다르게 변수형을 지정 해 주지 않아도 된다

Type 함수는 그 변수의 type이 어떤 것인지 알려준다.

1
2
3
4
5
6
7
8
9
10
11
12
N_int = 1
print (type(N_int))
#Type 함수 : type 을 print 해 준다

N1_float = 2.0
print (type(N1_float))

bool_N = True
print (type(bool_N))

X= None
print (type(X))
<class 'int'>
<class 'float'>
<class 'bool'>
<class 'NoneType'>

연산

  • 사칙연산

Number type

1
2
3
4
5
6
7
8
9
10
11
12
13
14
15
16
17
18
19
20
21
a = 1
b = 2
c = 3.14
d = 1.414
print ("정수_int_의 사칙연산 ")
print ('a + b = ' , a+b)
print('a - b = ', a-b)
print('a * b = ', a*b)
print('a / b = ', a/b)
print('a // b = ', a//b)
print('a % b = ', a%b)
print('a ** b = ', a**b)
print ("실수_float_의 사칙연산 ")
print('c + d =', c+d)
print('c - d =', c-d)
print('c * d =', c*d)
print('c / d =', c/d)
print('c // d =', c//d)
print('c % d =', c%d)
print('c ** d =', c**d)

정수_int_의 사칙연산 
a + b =  3
a - b =  -1
a * b =  2
a / b =  0.5
a // b =  0
a % b =  1
a ** b =  1
실수_float_의 사칙연산 
c + d = 4.554
c - d = 1.7260000000000002
c * d = 4.43996
c / d = 2.2206506364922207
c // d = 2.0
c % d = 0.3120000000000003
c ** d = 5.042646477882085
  • String 연산
1
2
3
4
str1 = "hi"
str2 = "bye"
print('str1 + str2 = ', str1 + str2 )
print ('str 1 * 3 + str * 2 = ', str1 * 3 + str2 * 2 )
str1 + str2 =  hibye
str 1 * 3 + str * 2 =  hihihibyebye

indexing

1
2
3
4
5
6
7
8
9
10
11
12
13
14
15
16
17
18
19
20
greeting = "Hi!Hellow? AnNyung!"
print(greeting)
#greeting, 이하니처럼 인사를 해 봅시다.

print(greeting[6:])
print(greeting [:6])


G = "12345 6789@"
print (G[2:])
print (G[:3])
print (G[1:9])
print (G[0:7:3])

"""
[a : b : c]
a : 시작 index
b : 끝 Index
c : 띄워서
"""
Hi!Hellow? AnNyung!
low? AnNyung!
Hi!Hel
345 6789@
123
2345 678
146


' \n[a : b : c]\n  a :  시작 index\n  b : 끝 Index\n  c : 띄워서\n'

List

  • List 함수 종류

    • .append() : 추가
    • .extend() : 연장
    • .remove() : 제거
    • .del() : 제거
    • .pop() :Index설정
    • .clear() : 전체 삭제

    Internet에 더 많은 함수를 찾을 수 있는 documents 가 있을 것이다.
    ^^

    List Function

List란, java로 치면 배열

List create 부터

1
2
3
4
5
6
7
8
9
10
11
12
13
14
15
16
17
18
19
20
21
22
23
24
25
26
27
28
29
30
31
32
33
34
35
36
37
38
39
40
41
42
print("List 를 생성 해 봅시다.")
A = [] #변수선언으로 빈 리스트 만들기
a= list() #List 함수로 만들기

a = ['I', 'Have', ['a', 'DreAm']]


print ("a함수에 직접적 Index로 넣어주기")
print (a)
print ("a[0]= 'YOU'의 결과 ")
a[0]= 'YOU'
print (a)


#List에 값 추가 해 주기
print(A)
A.append('U')
A.append('song')
A.append(['to', 'sing'])
print("A[0:] : A의 모든 원소 추출")
print(A[0:])
print(" ")
#Extend
print("a : a에 Extend를 이용하여 원소 추가하기")
print(a)
a.extend('U')
print(a)
a.extend(['song', 'to', 'sing'])
print(a)

#Extend 와 같은 느낌으로 "+=" 연산자를 써 줄수 있다.
print("a : a에 연산자를 이용하여 원소 추가하기")
a += ['Like U']
print(a)

#Insert는 중간에 인덱스 값을 넣어 주어서 List에 값을 추가 해 줄 수 있다.
print(a)
print("a : a에 insert를 이용하여 원하는 Index번호에 원소 추가하기")
a.insert(1,'do not')
print(a)
del a[1:1]
#다음 코드를 위해 a의 Index 1에 넣어준 원소를 제거 했음
List 를 생성 해 봅시다.
a함수에 직접적 Index로 넣어주기
['I', 'Have', ['a', 'DreAm']]
a[0]= 'YOU'의 결과 
['YOU', 'Have', ['a', 'DreAm']]
[]
A[0:] : A의 모든 원소 추출
['U', 'song', ['to', 'sing']]
 
a : a에 Extend를 이용하여 원소 추가하기
['YOU', 'Have', ['a', 'DreAm']]
['YOU', 'Have', ['a', 'DreAm'], 'U']
['YOU', 'Have', ['a', 'DreAm'], 'U', 'song', 'to', 'sing']
a : a에 연산자를 이용하여  원소 추가하기
['YOU', 'Have', ['a', 'DreAm'], 'U', 'song', 'to', 'sing', 'Like U']
['YOU', 'Have', ['a', 'DreAm'], 'U', 'song', 'to', 'sing', 'Like U']
a : a에 insert를 이용하여 원하는 Index번호에 원소 추가하기
['YOU', 'do not', 'Have', ['a', 'DreAm'], 'U', 'song', 'to', 'sing', 'Like U']

리스트 연산

1
2
C = a+A
print("a+A의 연산결과 : ", C)
['U', 'do not', 'song', 'to', 'sing', 'U', 'song', ['to', 'sing']]

리스트에 값 삭제 해 주기

1
2
3
4
5
6
7
8
9
10
11
12
13
14
15
16
17
18
19
20
21
22
23
24
25
26
27
28
29
30
31
32
33
34
35
36
37
38
39
40
41
42
43
44
45
46
b=[1, 2, 3, 4, 5, 6 ]
B=[7, 8, 9, 10, 11, 12, 13, 1, 4]
print("리스트 값 삭제하기 ")
print(b)
print(B)

print("b의 1번째 삭제")
#1개씩 삭제 해 주기
del b[1]
print(b)

print("B의 1~2 번째 삭제 : [1:2]")
#범위로 삭제 해 주기
del B[1:2]
print(B)


#중복 값을 삭제 해 주는 function
K=[0, 1, 2, 3, 4, 5, 8, 6, 7, 9, 10, 0, 12]
print("K : ", K)

K.remove(0)
print("K.remove(0) : ", K)

K.insert(0, 1)
print("K.insert(0,1) : ", K)


#pop은 Index를 정해서 특정 문자에 정해 줄 수 있다.
S = b.pop()
SS= B.pop(1)
print("b.pop() : ")
print (S, " : ()안에 아무것도 쓰지 않으면 맨 마지막 ")
print("B.pop(1) : ")
print(SS, " : ()안에 숫자를 쓰면 (1) 1번Index 뽑아내기")

#pop과 같은 느낌으로 특정 문자를 뽑아 내기
print("Index 숫자로 pop과 같은 기능을 실행 할 수 있다. ")
print (a[0:])
print (a[2][1])
print (a[2][1][3])

#List 전체 삭제


리스트 값 삭제하기 
[1, 2, 3, 4, 5, 6]
[7, 8, 9, 10, 11, 12, 13, 1, 4]
b의 1번째 삭제
[1, 3, 4, 5, 6]
B의 1~2 번째 삭제 : [1:2]
[7, 9, 10, 11, 12, 13, 1, 4]
K :  [0, 1, 2, 3, 4, 5, 8, 6, 7, 9, 10, 0, 12]
K.remove(0) :  [1, 2, 3, 4, 5, 8, 6, 7, 9, 10, 0, 12]
K.insert(0,1) :  [1, 1, 2, 3, 4, 5, 8, 6, 7, 9, 10, 0, 12]
b.pop() : 
6  : ()안에 아무것도 쓰지 않으면 맨 마지막 
B.pop(1) : 
9  : ()안에 숫자를 쓰면 (1) 1번Index 뽑아내기
Index 숫자로 pop과 같은 기능을 실행 할 수 있다. 
['hi', 'do not', 'Have', ['a', 'DreAm'], 'U', 'song', 'to', 'sing', 'd', 'i', 'd', ' ', 'n', 'o', 't']
a


---------------------------------------------------------------------------

IndexError                                Traceback (most recent call last)

<ipython-input-112-d37801788a81> in <module>()
     40 print (a[0:])
     41 print (a[2][1])
---> 42 print (a[2][1][3])
     43 
     44 #List 전체 삭제


IndexError: string index out of range

List 값을 덮어 쓰는 기능

1
2
3
4
5
6
7
8
print ("A[] = ", A) 
print ("A[1:2]= ['i', 'do', 'NOT', 'know']의 결과 ")
A[1:2]= ['i', 'do', 'NOT', 'know']
print (A)
# A[]에 1번 Index에 범위보다 큰 수가 엎어 씌어 진 것을 볼 수 있다.

del A [1:4]
print("del A [1:4] : ", A)
A[] =  ['U', 'i', 'do', 'NOT', 'know', 'do', 'NOT', 'know', 'do', 'NOT', 'know', ['to', 'sing']]
A[1:2]= ['i', 'do', 'NOT', 'know']의 결과 
['U', 'i', 'do', 'NOT', 'know', 'do', 'NOT', 'know', 'do', 'NOT', 'know', 'do', 'NOT', 'know', ['to', 'sing']]
del A [1:4] :  ['U', 'know', 'do', 'NOT', 'know', 'do', 'NOT', 'know', 'do', 'NOT', 'know', ['to', 'sing']]

Ref.

https://dojang.io/course/view.php?id=7

보고 공부 할 수 있어요

decisionTree Classifier()

DecisionTreeClassifier

Classifier function

Decision Tree Classifier는 데이터 집합에서 다중 클래스 분류를 수행할 수 있는 클래스이다.

다른 분류자와 마찬가지로 Decision Tre Classifier는 훈련 샘플을 고정하는 배열 X(n_샘플, n_특징)와 훈련 샘플에 대한 클래스 레이블을 고정하는 정수 값, 형상(n_샘플, n_특징)의 배열 Y의 두 배열을 입력으로 사용합니다.

1
2
3
4
5
from sklearn import tree
X = [[0, 0], [1, 1]]
Y = [0, 1]
clf = tree.DecisionTreeClassifier()
clf = clf.fit(X, Y)

이제 예측 모델을 만들어 봅시다.

1
2
clf.predict([[2., 2.]])
clf.predict_proba([[2., 2.]])
array([[0., 1.]])

의사결정트리의 분류는 classification과 multiclass 양쪽으로 모두 분류 할 수 있다.

iris dataset을 하용하면, 우리는 아래와 같은 plot_Tree를 만들 수 잇다.

1
2
3
4
5
6
7
from sklearn.datasets import load_iris
from sklearn import tree
iris = load_iris()
x, y = iris.data, iris.target
clf = tree.DecisionTreeClassifier()
clf = clf.fit(x, y)
tree.plot_tree(clf)
[Text(167.4, 199.32, 'X[2] <= 2.45\ngini = 0.667\nsamples = 150\nvalue = [50, 50, 50]'),
 Text(141.64615384615385, 163.07999999999998, 'gini = 0.0\nsamples = 50\nvalue = [50, 0, 0]'),
 Text(193.15384615384616, 163.07999999999998, 'X[3] <= 1.75\ngini = 0.5\nsamples = 100\nvalue = [0, 50, 50]'),
 Text(103.01538461538462, 126.83999999999999, 'X[2] <= 4.95\ngini = 0.168\nsamples = 54\nvalue = [0, 49, 5]'),
 Text(51.50769230769231, 90.6, 'X[3] <= 1.65\ngini = 0.041\nsamples = 48\nvalue = [0, 47, 1]'),
 Text(25.753846153846155, 54.359999999999985, 'gini = 0.0\nsamples = 47\nvalue = [0, 47, 0]'),
 Text(77.26153846153846, 54.359999999999985, 'gini = 0.0\nsamples = 1\nvalue = [0, 0, 1]'),
 Text(154.52307692307693, 90.6, 'X[3] <= 1.55\ngini = 0.444\nsamples = 6\nvalue = [0, 2, 4]'),
 Text(128.76923076923077, 54.359999999999985, 'gini = 0.0\nsamples = 3\nvalue = [0, 0, 3]'),
 Text(180.27692307692308, 54.359999999999985, 'X[2] <= 5.45\ngini = 0.444\nsamples = 3\nvalue = [0, 2, 1]'),
 Text(154.52307692307693, 18.119999999999976, 'gini = 0.0\nsamples = 2\nvalue = [0, 2, 0]'),
 Text(206.03076923076924, 18.119999999999976, 'gini = 0.0\nsamples = 1\nvalue = [0, 0, 1]'),
 Text(283.2923076923077, 126.83999999999999, 'X[2] <= 4.85\ngini = 0.043\nsamples = 46\nvalue = [0, 1, 45]'),
 Text(257.53846153846155, 90.6, 'X[1] <= 3.1\ngini = 0.444\nsamples = 3\nvalue = [0, 1, 2]'),
 Text(231.7846153846154, 54.359999999999985, 'gini = 0.0\nsamples = 2\nvalue = [0, 0, 2]'),
 Text(283.2923076923077, 54.359999999999985, 'gini = 0.0\nsamples = 1\nvalue = [0, 1, 0]'),
 Text(309.04615384615386, 90.6, 'gini = 0.0\nsamples = 43\nvalue = [0, 0, 43]')]

DecisionTreeClassifier

decision tree는 약 20여종의 parameter가 있다.

Parameter

  • criterion : 분할 품질을 측정하는 기능 (default : gini)
  • splitter : 각 노드에서 분할을 선택하는 데 사용되는 전략 (default : best)
  • max_depth : 트리의 최대 깊이 (값이 클수록 모델의 복잡도가 올라간다.)
  • min_samples_split : 자식 노드를 분할하는데 필요한 최소 샘플 수 (default : 2)
  • min_samples_leaf : 리프 노드에 있어야 할 최소 샘플 수 (default : 1)
  • min_weight_fraction_leaf : min_sample_leaf와 같지만 가중치가 부여된 샘플 수에서의 비율
  • max_features : 각 노드에서 분할에 사용할 특징의 최대 수
  • random_state : 난수 seed 설정
  • max_leaf_nodes : 리프 노드의 최대수
  • min_impurity_decrease : 최소 불순도
  • min_impurity_split : 나무 성장을 멈추기 위한 임계치
  • class_weight : 클래스 가중치
  • presort : 데이터 정렬 필요 여부
1
2
sklearn.tree.plot_tree(decision_tree, *, max_depth=None, feature_names=None, class_names=None, label='all', filled=False, impurity=True, node_ids=False, proportion=False, rounded=False, precision=3, ax=None, fontsize=None)
tree.plot_tree()

가장 원시적이면서 기본적인 parameter가 있는 decision tree의 parameter를 외우기 보다 지금 어떤 형태로 코드가 들어 가는지에 집중하자.

왜냐하면, 최신의 버전은 decision tree가 아니기 때문.

1
2
3
4
5
6
from sklearn.datasets import load_iris
from sklearn import tree

clf = tree.DecisionTreeClassifier(random_state=0)
iris = load_iris()