World Vs East Asia
##python을 이용한 plotly Library로 plot 그리기
subplots 를 이용하여 다중 그래프를 그려 보자.
python Library Import 1 2 3 4 5 6 7 8 9 10 11 12 13 14 15 16 17 18 19 20 21 22 23 import numpy as npimport pandas as pdimport seaborn as snsimport matplotlib.pylab as pltimport plotly.io as pioimport plotly.express as pximport plotly.graph_objects as goimport plotly.figure_factory as fffrom plotly.subplots import make_subplotsfrom plotly.offline import init_notebook_mode, iplotinit_notebook_mode(connected=True ) pio.templates.default = "none" import osfor dirname, _, filenames in os.walk('/kaggle/input' ): for filename in filenames: print (os.path.join(dirname, filename)) import warningswarnings.filterwarnings("ignore" )
data import 1 2 3 4 5 6 df17= pd.read_csv("/kaggle/input/kaggle-survey-2017/multipleChoiceResponses.csv" , encoding="ISO-8859-1" ) df18= pd.read_csv("/kaggle/input/kaggle-survey-2018/multipleChoiceResponses.csv" , ) df19= pd.read_csv("/kaggle/input/kaggle-survey-2019/multiple_choice_responses.csv" , ) df20= pd.read_csv("/kaggle/input/kaggle-survey-2020/kaggle_survey_2020_responses.csv" , ) df21= pd.read_csv("/kaggle/input/kaggle-survey-2021/kaggle_survey_2021_responses.csv" , )
data frame 전처리 i) Q3를 기준으로 EastAsia에 속하는 나라만 연도별로 뽑아냅니다.
1 2 3 4 5 6 7 8 9 10 11 12 13 14 15 16 17 18 19 20 21 22 23 24 25 26 27 28 29 30 31 32 df21_Ea=df21[df21['Q3' ].isin(EastAsia21)] Ea21= ( df21_Ea['Q3' ].value_counts().to_frame() .reset_index().rename(columns={'index' :'Country' , 'Q3' :'21' })) df20_Ea=df20[df20['Q3' ].isin(EastAsia)] Ea20= ( df20_Ea['Q3' ].replace('Republic of Korea' ,'South Korea' ) .value_counts().to_frame().reset_index() .rename(columns={'index' :'Country' , 'Q3' :'20' })) df19_Ea=df19[df19['Q3' ].isin(EastAsia)] Ea19= (df19_Ea['Q3' ].replace('Republic of Korea' ,'South Korea' ) .value_counts().to_frame().reset_index() .rename(columns={'index' :'Country' , 'Q3' :'19' })) df18_Ea=df18[df18['Q3' ].isin(EastAsia)] Ea18= (df18_Ea['Q3' ].replace('Republic of Korea' ,'South Korea' ) .value_counts().to_frame().reset_index() .rename(columns={'index' :'Country' , 'Q3' :'18' })) Ea18.value_counts() df17_Ea = df17[df17['Country' ].isin(EastAsia)] Ea17= (df17_Ea['Country' ].replace("People 's Republic of China" ,'China' ) .value_counts().to_frame().reset_index() .rename(columns={'index' :'Country' , 'Country' :'17' }))
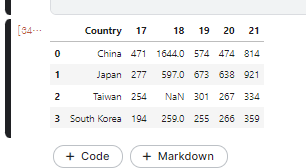
ii) data를 합쳐서 하나의 dataframe으로 만들음.
이 과정에서 pd.merge()를 사용 해 주었기 때문에 18’ taiwan data가 Nan으로 추가 되었다.
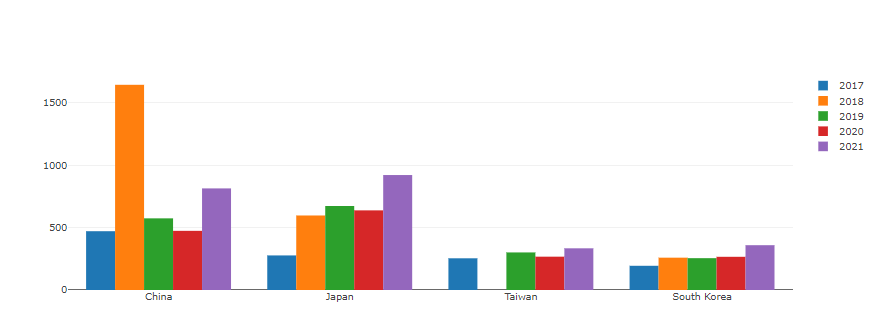
1 2 3 4 5 6 7 8 9 fig = go.Figure(data=[ go.Bar(name='2017' , x=df5years['Country' ], y=df5years['17' ]), go.Bar(name='2018' , x=df5years['Country' ], y=df5years['18' ]), go.Bar(name='2019' , x=df5years['Country' ], y=df5years['19' ]), go.Bar(name='2020' , x=df5years['Country' ], y=df5years['20' ]), go.Bar(name='2021' , x=df5years['Country' ], y=df5years['21' ]) ]) fig.show()
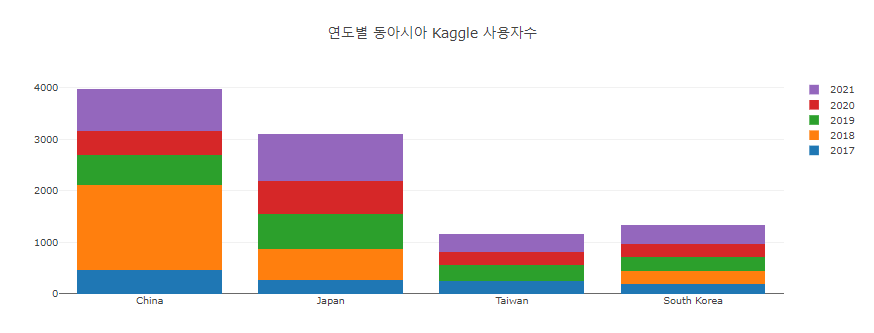
1 2 3 fig.update_layout(barmode='stack' , title='연도별 동아시아 Kaggle 사용자수' )
dictation 할 때 까지만 해도 bar 그래프 그리는 것이 뭐그리 어렵겠나? 했다.
그냥 복사 붙여넣기로 만드려고 했는데
그게 참 안되네 ㅂㄷㅂㄷ
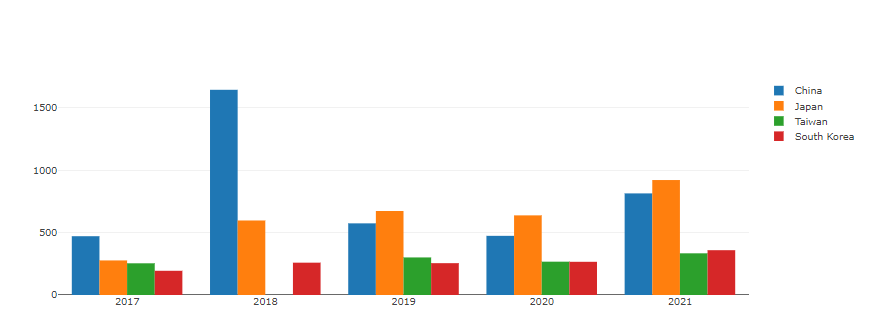
1 2 3 4 5 6 7 8 9 10 11 12 13 14 15 df5years_ =df5years.transpose() df5years_= df5years_.iloc[1 :] fig2 = go.Figure(data=[ go.Bar(name='China' , x=years, y=df5years_[0 ]), go.Bar(name='Japan' , x=years, y=df5years_[1 ]), go.Bar(name='Taiwan' , x=years, y=df5years_[2 ]), go.Bar(name='South Korea' , x=years, y=df5years_[3 ]), ]) fig2.show()
축 reverse로 할까말까 고민중.
어떤게 더 잘 보여 줄 수 있을까 … ㅜㅜ


