Scatter with bar

#Kgg 대회 준비

Scatter와 bar가 함께 있는 Graph를 그려 보았다.

1
2
3
4
5
6
7
8
9
10
11
12
13
14
15
16
17
18
19
20
21
22
23
24
25
26
27
28
29
fig = go.Figure()
y=[len(df17_Ea),len(df18_Ea), len(df19_Ea),len(df20_Ea),len(df21_Ea)]
fig.add_trace(go.Bar(x=years, y=y,
base=0,
marker_color='#D9946C',
yaxis = "y1",
name='East Asia',
text= percent,
texttemplate='%{text} %',
textposition='outside',
hovertemplate='<b>KaggleUser</b>: %{x}<br>'+
'<b>Count</b>: %{y}',
textfont_size=14
))
fig.add_trace(
go.Scatter(name = "World",
x=years,
y=[len(df17), len(df18), len(df19), len(df20), len(df21)],
marker_color='#88BFBA',
mode = 'lines+markers', # please check option here
yaxis = "y2"))

fig.update_layout(yaxis = dict(title = "KaggleUser in World", showgrid = False, range=[0, len(df21_Ea)*1.2]),
yaxis2 = dict(title = "KaggleUser in East Asia", overlaying = "y1", side = "right", showgrid = False,
zeroline = False,
range=[0, len(df21)*1.2]), # This code solves the different zero set but with same zero values.
template = "plotly_white", height=500, width=700,)

fig.show()

vbar_scatters

age data , 연도별로

1
2
3
4
5
6
7
8
9
10
11
12
13
14
15
16
17
18
19
20
21
22
23
24
25
26
27
28
29
30
31
32
33
34
35
36
37
38
39
40
41
42
43
44
45
46
47
48
49
50
51
52
53
54
55
56
57
58
59
60
61
62
63
64
65
66
67
68
69
70
71
72
73
74
75
76
77
78
79
80
81
82
83
84
85
86
87
88
89
90
91
92
93
94
#age data 전처리
# age 뽑아오기
Age21_W = df21.loc[:,['Q3','Q1', 'year']].reset_index().rename(columns={'Q3':'East_Asia', 'Q1':'age'}).fillna('etc')
Age20_W = df20.loc[:,['Q3','Q1','year']].reset_index().rename(columns={'Q3':'East_Asia', 'Q1':'age'}).fillna('etc')
Age19_W = df19.loc[:,['Q3','Q1','year']].reset_index().rename(columns={'Q3':'East_Asia', 'Q1':'age'}).fillna('etc')
Age18_W = df18.loc[:,['Q3','Q2','year']].reset_index().rename(columns={'Q3':'East_Asia', 'Q2':'age'}).fillna('etc')

#data 정제(한꺼번에 이름바꾸기)
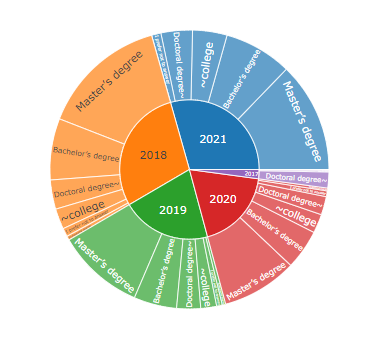
Age5y_W= pd.concat([Age21_W, Age20_W, Age19_W, Age18_W])
Age5y_W= (Age5y_W.replace(['60-69', '70+', '70-79', '80+'], '60+')
.replace(['22-24', '25-29'], '22-29')
.replace(['30-34', '35-39'], '30-39')
.replace(['40-44', '45-49'], '40-49')
.replace(['50-54', '55-59'], '50-59')
.groupby(['year', 'age'])
.size()
.reset_index()
.rename(columns = {0:"Count"}))

#percent data 넣기
Age21_percent_W = Age5y_W[Age5y_W['year'] == "2021"].reset_index(drop = True)
Age21_percent_W['percentage'] = Age21_percent_W["Count"] / Age21_percent_W["Count"].sum()
Age21_percent_W['%'] = np.round(Age21_percent_W['percentage'] * 100, 1)


Age20_percent_W = Age5y_W[Age5y_W['year'] == "2020"].reset_index(drop = True)
Age20_percent_W['percentage'] = Age20_percent_W["Count"] / Age20_percent_W["Count"].sum()
Age20_percent_W['%'] = np.round(Age20_percent_W['percentage'] * 100, 1)


Age19_percent_W = Age5y_W[Age5y_W['year'] == "2019"].reset_index(drop = True)
Age19_percent_W['percentage'] = Age19_percent_W["Count"] / Age19_percent_W["Count"].sum()
Age19_percent_W['%'] = np.round(Age19_percent_W['percentage'] * 100, 1)


Age18_percent_W = Age5y_W[Age5y_W['year'] == "2018"].reset_index(drop = True)
Age18_percent_W['percentage'] = Age18_percent_W["Count"] / Age18_percent_W["Count"].sum()
Age18_percent_W['%'] = np.round(Age18_percent_W['percentage'] * 100, 1)


#data 완성
Age5y_percent_W = pd.concat([Age18_percent_W, Age19_percent_W, Age20_percent_W, Age21_percent_W], ignore_index = True)
Age5y_percent_W= pd.pivot(Age5y_percent_W, index = "year", columns = 'age', values = "%").reset_index()
Age5y_percent_W


#age data 전처리
# age 뽑아오기
Age21 = df21_Ea.loc[:,['Q3','Q1', 'year']].reset_index().rename(columns={'Q3':'East_Asia', 'Q1':'age'}).fillna('etc')
Age20 = df20_Ea.loc[:,['Q3','Q1','year']].reset_index().rename(columns={'Q3':'East_Asia', 'Q1':'age'}).fillna('etc')
Age19 = df19_Ea.loc[:,['Q3','Q1','year']].reset_index().rename(columns={'Q3':'East_Asia', 'Q1':'age'}).fillna('etc')
Age18 = df18_Ea.loc[:,['Q3','Q2','year']].reset_index().rename(columns={'Q3':'East_Asia', 'Q2':'age'}).fillna('etc')

#data 정제(한꺼번에 이름바꾸기)
Age5y= pd.concat([Age21, Age20, Age19, Age18])
Age5y= (Age5y.replace(['60-69', '70+', '70-79', '80+'], '60+')
.replace(['22-24', '25-29'], '22-29')
.replace(['30-34', '35-39'], '30-39')
.replace(['40-44', '45-49'], '40-49')
.replace(['50-54', '55-59'], '50-59')
.groupby(['year', 'age'])
.size()
.reset_index()
.rename(columns = {0:"Count"}))

#percent data 넣기
Age21_percent = Age5y[Age5y['year'] == "2021"].reset_index(drop = True)
Age21_percent['percentage'] = Age21_percent["Count"] / Age21_percent["Count"].sum()
Age21_percent['%'] = np.round(Age21_percent['percentage'] * 100, 1)
Age21_percent

Age20_percent = Age5y[Age5y['year'] == "2020"].reset_index(drop = True)
Age20_percent['percentage'] = Age20_percent["Count"] / Age20_percent["Count"].sum()
Age20_percent['%'] = np.round(Age20_percent['percentage'] * 100, 1)
Age20_percent

Age19_percent = Age5y[Age5y['year'] == "2019"].reset_index(drop = True)
Age19_percent['percentage'] = Age19_percent["Count"] / Age19_percent["Count"].sum()
Age19_percent['%'] = np.round(Age19_percent['percentage'] * 100, 1)
Age19_percent

Age18_percent = Age5y[Age5y['year'] == "2018"].reset_index(drop = True)
Age18_percent['percentage'] = Age18_percent["Count"] / Age18_percent["Count"].sum()
Age18_percent['%'] = np.round(Age18_percent['percentage'] * 100, 1)
Age18_percent


#data 완성
Age5y_percent = pd.concat([Age18_percent, Age19_percent, Age20_percent, Age21_percent], ignore_index = True)
Age5y_percent= pd.pivot(Age5y_percent, index = "year", columns = 'age', values = "%").reset_index()
Age5y_percent


Graph 그리기 _1_World

1
2
3
4
5
6
7
8
9
10
11
12
13
14
15
16
17
18
19
20
21
22
23
24
25
26
27
28
29
30
31
32
33
34
35
36
37
38
39
40
41
42
43
44
45
46
47
48
49
50
51
52
53
54
55
56
57
58
59
60
61
62
63
64

Age5y_percent_order = Age5y_percent_W['year'].tolist()


Age5y_order = Age5y_W['age'].unique().tolist()

fig = go.Figure()

fig.add_trace(go.Scatter(
x = Age5y_percent_order,
y = Age5y_percent_W['18-21'].tolist(),
mode = "lines",
name = '18-21',
line = dict(width = 1),
stackgroup = "one"
))

fig.add_trace(go.Scatter(
x = Age5y_percent_order,
y = Age5y_percent_W['22-29'].tolist(),
mode = "lines",
name = "20s",
line = dict(width = 1),
stackgroup = "one"
))
fig.add_trace(go.Scatter(
x = Age5y_percent_order,
y = Age5y_percent_W['30-39'].tolist(),
mode = "lines",
name = "30s",
line = dict(width = 1),
stackgroup = "one"
))

fig.add_trace(go.Scatter(
x = Age5y_percent_order,
y = Age5y_percent_W['40-49'].tolist(),
mode = "lines",
name = "40s",
line = dict(width = 1),
stackgroup = "one"
))
fig.add_trace(go.Scatter(
x = Age5y_percent_order,
y = Age5y_percent_W['50-59'].tolist(),
mode = "lines",
name = "50s",
line = dict(width = 1),
stackgroup = "one"
))
fig.add_trace(go.Scatter(
x = Age5y_percent_order,
y = Age5y_percent_W['60+'].tolist(),
mode = "lines",
name = "60s<",
line = dict(width = 1),
stackgroup = "one"
))

fig.update_layout(yaxis_range = (0, 100), height=500, width=600,
title_text="<b>in world 나이의 변화</b>",
title_x=0.5)

fig.show()

AgePerYears_Inwo

Graph 그리기 _1_in East Asia

1
2
3
4
5
6
7
8
9
10
11
12
13
14
15
16
17
18
19
20
21
22
23
24
25
26
27
28
29
30
31
32
33
34
35
36
37
38
39
40
41
42
43
44
45
46
47
48
49
50
51
52
53
54
55
56
57
58
59
60
61
62
63
64

Age5y_percent_order = Age5y_percent['year'].tolist()


Age5y_order = Age5y['age'].unique().tolist()

fig = go.Figure()

fig.add_trace(go.Scatter(
x = Age5y_percent_order,
y = Age5y_percent['18-21'].tolist(),
mode = "lines",
name = '18-21',
line = dict(width = 1),
stackgroup = "one"
))

fig.add_trace(go.Scatter(
x = Age5y_percent_order,
y = Age5y_percent['22-29'].tolist(),
mode = "lines",
name = "20s",
line = dict(width = 1),
stackgroup = "one"
))
fig.add_trace(go.Scatter(
x = Age5y_percent_order,
y = Age5y_percent['30-39'].tolist(),
mode = "lines",
name = "30s",
line = dict(width = 1),
stackgroup = "one"
))

fig.add_trace(go.Scatter(
x = Age5y_percent_order,
y = Age5y_percent['40-49'].tolist(),
mode = "lines",
name = "40s",
line = dict(width = 1),
stackgroup = "one"
))
fig.add_trace(go.Scatter(
x = Age5y_percent_order,
y = Age5y_percent['50-59'].tolist(),
mode = "lines",
name = "50s",
line = dict(width = 1),
stackgroup = "one"
))
fig.add_trace(go.Scatter(
x = Age5y_percent_order,
y = Age5y_percent['60+'].tolist(),
mode = "lines",
name = "60s<",
line = dict(width = 1),
stackgroup = "one"
))

fig.update_layout(yaxis_range = (0, 100), height=500, width=600,
title_text="<b>East Asia 나이의 변화</b>",
title_x=0.5)

fig.show()

AgePerYears_InEa

1
2
3
4
5
6
7
8
9
10
11
12
13
14
15
16
17
18
19
20
21
22
23
24
25
26
27
28
29
30
31
32
33
34
35
36
37
38
39
40
41
42
43
44
45
46
47
48
# 연도별 나이 
df21Age_Ea = df21_Ea.loc[:,['Q3','Q1']].reset_index().rename(columns={'Q3':'East_Asia', 'Q1':'2021'}).fillna('etc')

# 연령-지역 %
dfKo_Age21= df21Age_Ea[df21Age_Ea['East_Asia']=='South Korea']
dfKo_Age21_per=dfKo_Age21['2021'].value_counts().to_frame().reset_index()
dfKo_Age21_per['South Korea']=((dfKo_Age21_per['2021'] / len(dfKo_Age21))*100).round(2)

dfTw_Age21= df21Age_Ea[df21Age_Ea['East_Asia']=='Taiwan']
dfTw_Age21_per=dfTw_Age21['2021'].value_counts().to_frame().reset_index()
dfTw_Age21_per['Taiwan']=((dfTw_Age21_per['2021'] / len(dfTw_Age21))*100).round(2)
dfTw_Age21_per

dfCh_Age21= df21Age_Ea[df21Age_Ea['East_Asia']=='China']
dfCh_Age21_per=dfCh_Age21['2021'].value_counts().to_frame().reset_index()
dfCh_Age21_per['China']=((dfCh_Age21_per['2021'] / len(dfCh_Age21))*100).round(2)
dfCh_Age21_per

df21Age_Ea.head()
dfJp_Age21= df21Age_Ea[df21Age_Ea['East_Asia']=='Japan']
dfJp_Age21_per=dfJp_Age21['2021'].value_counts().to_frame().reset_index()
dfJp_Age21_per['Japan']=((dfJp_Age21_per['2021'] / len(dfJp_Age21))*100).round(2)
dfJp_Age21_per


#g 그리기(heatMap)
merge1= pd.merge(dfKo_Age21_per,dfTw_Age21_per, on='index', how='outer')
merge2= pd.merge(dfCh_Age21_per,dfJp_Age21_per, on='index', how='outer')
merge= pd.merge(merge1,merge2, on='index', how='outer').fillna(0).sort_values(by=['index'],ascending=True)

merge.iloc[:,[2,4,6,8]]
merge.iloc[:,[2,4,6,8]].to_numpy()


fig = go.Figure(data=go.Heatmap(
z=merge.iloc[:,[2,4,6,8]].to_numpy(),
x=['South Korea','Taiwan','China','Japan'],
y=merge.sort_values(by=['index'],ascending=True)['index'].tolist(),
hoverongaps = False,
opacity=1.0, xgap=2.5, ygap=2.5, colorscale='orrd'),
)

fig.update_layout( height=500, width=600,
title_text="<b>East Asia 나이 2021</b>",
title_x=0.5)
fig.show()

HeatMap_Eastandage

1
2
3
4
5
6
7
8
9
10
11
12
13
14
15
16
17
18
19
20
21
22
23
24
25
26
27
28
29
30
31
32
33
34
35
36
#데이터 전처리
df21_Ea_degree=(df21_Ea['Q4'].replace(['No formal education past high school',
'Some college/university study without earning a bachelor’s degree'],'~college')
.replace(['Doctoral degree',
'Professional doctorate'],'Doctoral degree~').value_counts().to_frame().rename(columns={'Q4':'2021'}))
df20_Ea_degree=(df20_Ea['Q4'].replace(['No formal education past high school',
'Some college/university study without earning a bachelor’s degree'],'~college')
.replace(['Doctoral degree',
'Professional doctorate'],'Doctoral degree~').value_counts().to_frame().rename(columns={'Q4':'2020'}))
df19_Ea_degree=(df19_Ea['Q4'].replace(['No formal education past high school',
'Some college/university study without earning a bachelor’s degree'],'~college')
.replace(['Doctoral degree',
'Professional doctorate'],'Doctoral degree~').value_counts().to_frame().rename(columns={'Q4':'2019'}))
df18_Ea_degree=(df18_Ea['Q4'].replace(['No formal education past high school',
'Some college/university study without earning a bachelor’s degree'],'~college')
.replace(['Doctoral degree',
'Professional doctorate'],'Doctoral degree~').value_counts().to_frame().rename(columns={'Q4':'2018'}))
df17_Ea_degree=(df17_Ea['FormalEducation'].replace(['No formal education past high school',
'Some college/university study without earning a bachelor’s degree'],'~college')
.replace(['Doctoral degree',
'Professional doctorate'],'Doctoral degree~')
.value_counts().to_frame()
.rename(columns={'FormalEducation':'2017'})
.rename(index = {'I did not complete any formal education past high school':'No formal education past high school'}))

concat1 = pd.concat([df21_Ea_degree,df20_Ea_degree],axis=1, join='outer')
concat2 = pd.concat([df19_Ea_degree,df18_Ea_degree],axis=1, join='outer')
concat3 = pd.concat([concat1,concat2],axis=1, join='outer')

df21_Ea_degree_yearly_=concat3.join(df17_Ea_degree).fillna(0).transpose() #.transpose() 행 열 바꾸기
df21_Ea_degree_yearly=df21_Ea_degree_yearly_.stack().to_frame().reset_index().rename(columns={'level_0':'year','level_1':'degree',0:'value'})
df21_Ea_degree_yearly

#그래프 그리기
fig = px.sunburst(df21_Ea_degree_yearly, path=['year','degree'], values=df21_Ea_degree_yearly['value'].tolist())
fig.show()

piepie_G

Column 뽑아오기

-python: for문으로 뽑아오기

1
2
3
4
5
for column in df17_Ea:
... print(column)

df.coulumns
#이건 column 이름 나옴

Q17_column

경력은 Tenure 인거 같다.

1
df18.loc[:0]

Question을 다 삭제 해 버렸는데

질문 정히 해 놓은 것이 사라지면 어쩔 수 없이 다시 불러와야지

Q17_Question

판다스 옵션

  • pandas 옵션을 조정하여 생략없이 긴 data를 볼 수 있다.
1
pd.describe_option()

PandasOPtion

1
pd.set_option('display.max_seq_items', None)
1
2
3
4
# row 생략 없이 출력
pd.set_option('display.max_rows', None)
# col 생략 없이 출력
pd.set_option('display.max_columns', None)

경력 : [Tenure] in df17, [Q8] in df18, [Q15] in 19, [Q6] in 20, [Q6]in 21
연봉 : [Q9] in df18, [Q10] in df19, [Q24] in 20, [Q25]in 21
*2017연봉의 경우 ‘CompensationAmount’ 컬럼에 있지만, 통화가 다르므로 하지 말자.

kaggle HeatMap

Kaggle 을 쓰는 East Asia의 사람들

  • Kaggle 정의
  • Kaggle 설문조사_개요
  • 그런데 우리는 EA에살아서 궁긍한 걸 찾아보자.

data import

1
2
3
4
5
6
7
8
9
10
11
12
13
14
15
16
17
18
19
20
21
22
23
import numpy as np
import pandas as pd
import seaborn as sns
import matplotlib.pylab as plt

import plotly.io as pio
import plotly.express as px
import plotly.graph_objects as go
import plotly.figure_factory as ff
from plotly.subplots import make_subplots
from plotly.offline import init_notebook_mode, iplot
init_notebook_mode(connected=True)
pio.templates.default = "none"
# import plotly.offline as py
# py.offline.init_notebook_mode()

import os
for dirname, _, filenames in os.walk('/kaggle/input'):
for filename in filenames:
print(os.path.join(dirname, filename))

import warnings
warnings.filterwarnings("ignore")
/kaggle/input/kaggle-survey-2018/SurveySchema.csv
/kaggle/input/kaggle-survey-2018/freeFormResponses.csv
/kaggle/input/kaggle-survey-2018/multipleChoiceResponses.csv
/kaggle/input/kaggle-survey-2020/kaggle_survey_2020_responses.csv
/kaggle/input/kaggle-survey-2020/supplementary_data/kaggle_survey_2020_methodology.pdf
/kaggle/input/kaggle-survey-2020/supplementary_data/kaggle_survey_2020_answer_choices.pdf
/kaggle/input/kaggle-survey-2021/kaggle_survey_2021_responses.csv
/kaggle/input/kaggle-survey-2021/supplementary_data/kaggle_survey_2021_methodology.pdf
/kaggle/input/kaggle-survey-2021/supplementary_data/kaggle_survey_2021_answer_choices.pdf
/kaggle/input/kaggle-survey-2019/survey_schema.csv
/kaggle/input/kaggle-survey-2019/multiple_choice_responses.csv
/kaggle/input/kaggle-survey-2019/other_text_responses.csv
/kaggle/input/kaggle-survey-2019/questions_only.csv
/kaggle/input/kaggle-survey-2017/freeformResponses.csv
/kaggle/input/kaggle-survey-2017/schema.csv
/kaggle/input/kaggle-survey-2017/RespondentTypeREADME.txt
/kaggle/input/kaggle-survey-2017/multipleChoiceResponses.csv
/kaggle/input/kaggle-survey-2017/conversionRates.csv
1
2
3
4
5
6
df17= pd.read_csv("/kaggle/input/kaggle-survey-2017/multipleChoiceResponses.csv", encoding="ISO-8859-1")
df18= pd.read_csv("/kaggle/input/kaggle-survey-2018/multipleChoiceResponses.csv", )
df19= pd.read_csv("/kaggle/input/kaggle-survey-2019/multiple_choice_responses.csv", )
df20= pd.read_csv("/kaggle/input/kaggle-survey-2020/kaggle_survey_2020_responses.csv", )
df21= pd.read_csv("/kaggle/input/kaggle-survey-2021/kaggle_survey_2021_responses.csv", )

EastAsia VS World

1. data 전처리

1.1 EastAsia / World 나누기

1
2
3
4
5
6
7
8
9
10
11
12
13
14
15
16
17
18
19
20
21
22
23
24
25
26
27
28
29
30
31
32
33
34
35
36
37
38
39
40
41
42
43
44
45
#질문 제거하기, replace
df17= df17.iloc[1:, :].replace("People 's Republic of China",'China')
df18= df18.iloc[1:, :].replace('Republic of Korea','South Korea')
df19= df19.iloc[1:, :].replace('Republic of Korea','South Korea')
df20= df20.iloc[1:, :].replace('Republic of Korea','South Korea')
df21= df21.iloc[1:, :]


## East Asia에는 대한민국, 일본, 중국, 타이완, 몽골, 북조선 총 6개의 국가가 속해 있다.
## 알 수 없지만, 18년도엔 타이완이 없다.

EastAsia17 = ['China',"People 's Republic of China", 'Taiwan', 'South Korea', 'Japan']
EastAsia18= ['China', 'South Korea', 'Japan', 'Republic of Korea']
EastAsia19 = ['China','Taiwan', 'South Korea', 'Japan', 'Republic of Korea']
EastAsia20 = ['China','Taiwan', 'South Korea','Republic of Korea', 'Japan']
EastAsia21 = ['China','Taiwan', 'South Korea', 'Japan']

EastAsia = ['Republic of Korea','China','Taiwan', 'South Korea', 'Japan', "People 's Republic of China" ]

years = ['2017', '2018', '2019', '2020', '2021']

#East Asia 뽑기
df21_Ea = df21[df21['Q3'].isin(EastAsia)]
df21_Wo = df21[~df21['Q3'].isin(EastAsia)]
df21['region']=["EastAsia" if x in EastAsia else "World" for x in df21['Q3']]


df20_Ea = df20[df20['Q3'].isin(EastAsia)]
df20_Wo = df20[~df20['Q3'].isin(EastAsia)]
df20['region']=["EastAsia" if x in EastAsia else "World" for x in df20['Q3']]

df19_Ea = df19[df19['Q3'].isin(EastAsia)]
df19_Wo = df19[~df19['Q3'].isin(EastAsia)]
df19['region']=["EastAsia" if x in EastAsia else "World" for x in df19['Q3']]

df18_Ea = df18[df18['Q3'].isin(EastAsia)]
df18_Wo = df18[~df18['Q3'].isin(EastAsia)]
df18['region']=["EastAsia" if x in EastAsia else "World" for x in df18['Q3']]

df17_Ea = df17[df17['Country'].isin(EastAsia)]
df17_Wo = df17[~df17['Country'].isin(EastAsia)]
df17['region']=["EastAsia" if x in EastAsia else "World" for x in df17['Country']]

#df21['region'].to_frame().value_counts().to_frame().rename(columns={'region': '21y', '' : 'count'})
print('OK')
OK
1
2
3
4
5
6
7
8
9
10
11
12
13
14
15
16
17
18
19
20
21
22
23
24
# 나라별 data 뽑기
df21_Ch= df21_Ea[df21_Ea['Q3'] == 'China']
df21_Tw= df21_Ea[df21_Ea['Q3'] == 'South Korea']
df21_Ko= df21_Ea[df21_Ea['Q3'] == 'Taiwan']
df21_Jp= df21_Ea[df21_Ea['Q3'] == 'Japan']

df20_Ch= df20_Ea[df20_Ea['Q3'] == 'China']
df20_Tw= df20_Ea[df20_Ea['Q3'] == 'South Korea']
df20_Ko= df20_Ea[df20_Ea['Q3'] == 'Taiwan']
df20_Jp= df20_Ea[df20_Ea['Q3'] == 'Japan']

df19_Ch= df19_Ea[df19_Ea['Q3'] == 'China']
df19_Tw= df19_Ea[df19_Ea['Q3'] == 'South Korea']
df19_Ko= df19_Ea[df19_Ea['Q3'] == 'Taiwan']
df19_Jp= df19_Ea[df19_Ea['Q3'] == 'Japan']

df18_Ch= df18_Ea[df18_Ea['Q3'] == 'China']
df18_Tw= df18_Ea[df18_Ea['Q3'] == 'South Korea']
df18_Jp= df18_Ea[df18_Ea['Q3'] == 'Japan']

df17_Ch= df17_Ea[df17_Ea['Country'] == 'China']
df17_Tw= df17_Ea[df17_Ea['Country'] == 'South Korea']
df17_Ko= df17_Ea[df17_Ea['Country'] == 'Taiwan']
df17_Jp= df17_Ea[df17_Ea['Country'] == 'Japan']

2. Kaggle 사용자수 (W/Ea)

2.1 data 전처리

2.2 그래프 그리기

1
2
3
4
5
6
7
8
9
10
11
12
13
14
15
16
17
18
19
20
21
22
23
24
25
26
27
28
29
30
31
32
33
34
35
def world_map(locations,counts,title):
data = [ dict(
type = 'choropleth',
locations = locations,
z = counts,
colorscale = 'Blues',
locationmode = 'country names',
autocolorscale = False,
reversescale = True,
marker = dict(
line = dict(color = '#F7F7F7', width = 1.5)),
colorbar = dict(autotick = True, legth = 3, len=0.75, title = 'respodents',
max = 1000, min = 0)
)
]
layout = dict(
title = title,
titlefont={'size': 28, 'family': 'san serif'},
width=750,
height=475,
paper_bgcolor='#F7F7F7',
geo = dict(
showframe = True,
showcoastlines = True,
fitbounds="locations",
)
)

fig = dict(data=data, layout=layout)
iplot(fig, validate=False, filename='world-map')

z = df21_Ea['Q3'].value_counts()

## 메서드 호출
world_map(locations=z.index, counts=z.values, title= '<b> EastAsia Countries (2021 survey) <b>')
1
2
3
4
5
6
7
8
9
10
11
12
13
14
15
16
17
18
19
20
21
22
23
24
25
26
27
28
29
30
31
32
33
34
35
36
37
38
39
40
41
42
43
44
45
46
47
48
49
50
51
52
53
54
55
56
57
# 수치 bar g = 사용자 수 비교.

Ea21 = len(df21_Ea)
Wo21 = len(df21) - len(df21_Ea)

Ea20 = len(df20_Ea)
Wo20 = len(df20) - len(df20_Ea)

Ea19 = len(df19_Ea)
Wo19 = len(df19) - len(df19_Ea)

Ea18 = len(df18_Ea)
Wo18 = len(df18) - len(df18_Ea)

Ea17 = len(df17_Ea)
Wo17 = len(df17) - len(df17_Ea)

years = ['2017','2018','2019','2020', '2021']

def percent (a, b):
result =a/(a+b)*100
result = np.round(result)
return result

def percentR (b, a):
result =a/(a+b)*100
result = np.round(result)
return result

percent = [percent(Ea17, Wo17), percent(Ea18, Wo18), percent(Ea19, Wo19),
percent(Ea20, Wo20), percent(Ea21, Wo21)]

# percentR = [percentR(Ea17, Wo17), percentR(Ea18, Wo18), percentR(Ea19, Wo19),
# percentR(Ea20, Wo20), percentR(Ea21, Wo21)]
fig = go.Figure()
fig.add_trace(go.Bar(x=years, y=[len(df17), len(df18), len(df19), len(df20), len(df21)],
base=[-len(df17), -len(df18), -len(df19), -len(df20), -len(df21)],
marker_color='lightslategrey',
name='World',
textposition='outside',
hovertemplate='<b>KaggleUser</b>: %{x}<br>'+
'<b>Count</b>: %{y}'

))
fig.add_trace(go.Bar(x=years, y=[Ea17, Ea18, Ea19, Ea20, Ea21],
base=0,
marker_color='pink',
name='East Asia',
text= percent,
texttemplate='%{text} %',
textposition='outside',
hovertemplate='<b>KaggleUser</b>: %{x}<br>'+
'<b>Count</b>: %{y}',
textfont_size=12
))
fig.update_layout(width=600, height=700)
fig.show()
1
2
3
4
5
6
7
8
9
10
11
12
13
14
15
16
17
18
19
20
21
22
23
24
25
26
27
28
29
30
31
32
33
34
35
36
37
38
39
40
41
42
43
44
45
46
47
48
49
50
51
52
53
54
55
56
57
58
59
60
61
62
63
64
65
66
67
68
69
70
71
72
73
74
75
76
77
from plotly.subplots import make_subplots
import plotly.graph_objects as go

total17 = (
df17['region']
.value_counts()
.to_frame()
.reset_index()
.rename(columns={'index':'type', 'region':'respodents'})
.groupby('type')
.sum()
.reset_index()
)
total18 = (
df18['region']
.value_counts()
.to_frame()
.reset_index()
.rename(columns={'index':'type', 'region':'respodents'})
.groupby('type')
.sum()
.reset_index()
)
total19 = (
df19['region']
.value_counts()
.to_frame()
.reset_index()
.rename(columns={'index':'type', 'region':'respodents'})
.groupby('type')
.sum()
.reset_index()
)
total20 = (
df20['region']
.value_counts()
.to_frame()
.reset_index()
.rename(columns={'index':'type', 'region':'respodents'})
.groupby('type')
.sum()
.reset_index()
)
total21 = (
df21['region']
.value_counts()
.to_frame()
.reset_index()
.rename(columns={'index':'type', 'region':'respodents'})
.groupby('type')
.sum()
.reset_index()
)


# Create subplots: use 'domain' type for Pie subplot
fig = make_subplots(rows=1, cols=5, specs=[[{'type':'domain'}, {'type':'domain'}, {'type':'domain'}, {'type':'domain'}, {'type':'domain'}]],
subplot_titles=("2017", "2018", "2019", "2020", "2021"))
fig.add_trace(go.Pie(labels=total21['type'], values=total21['respodents'], name="2021", scalegroup='one'),
1, 1)
fig.add_trace(go.Pie(labels=total20['type'], values=total20['respodents'], name="2020", scalegroup='one'),
1, 2)
fig.add_trace(go.Pie(labels=total19['type'], values=total19['respodents'], name="2019", scalegroup='one'),
1, 3)
fig.add_trace(go.Pie(labels=total18['type'], values=total18['respodents'], name="2018", scalegroup='one'),
1, 4)
fig.add_trace(go.Pie(labels=total17['type'], values=total17['respodents'], name="2017", scalegroup='one'),
1, 5)

# Use `hole` to create a donut-like pie chart
fig.update_traces(hole=.2, hoverinfo="label+percent+name")
fig.update_layout(
title_text="<b>World vs EastAsia</b>",
# Add annotations in the center of the donut pies.
)
fig.show()

가설은 시간에따라서 응답자수가 증가 할 줄 알았는데 결과를 보니 오히려 감소하는 경향을 볼 수 있다.

East Asia 응답자는 2020년도(10.5%)에 가장 많았고 2121년도(7.15%)로 가장 적엇다.

0. Kaggle Gender (in Ea)

0.1 data 전처리

0.2 그래프 그리기

1
2
3
4
5
6
7
8
9
10
11
12
13
14
15
16
17
18
19
20
21
22
23
24
25
26
27
28
29
30
31
32
33
34
35
36
37
38
39
40
41
42
43
44
45
46
47
48
49
50
51
52
53
54
55
56
57
58
59
60
61
62
63


df21_Ea=df21[df21['Q3'].isin(EastAsia21)]
Ea21= (
df21_Ea['Q3'].value_counts().to_frame()
.reset_index().rename(columns={'index':'Country', 'Q3':'21'}))


df20_Ea=df20[df20['Q3'].isin(EastAsia)]
Ea20= (
df20_Ea['Q3'].replace('Republic of Korea','South Korea')
.value_counts().to_frame().reset_index()
.rename(columns={'index':'Country', 'Q3':'20'}))


df19_Ea=df19[df19['Q3'].isin(EastAsia)]
Ea19= (df19_Ea['Q3'].replace('Republic of Korea','South Korea')
.value_counts().to_frame().reset_index()
.rename(columns={'index':'Country', 'Q3':'19'}))


df18_Ea=df18[df18['Q3'].isin(EastAsia)]
Ea18= (df18_Ea['Q3'].replace('Republic of Korea','South Korea')
.value_counts().to_frame().reset_index()
.rename(columns={'index':'Country', 'Q3':'18'}))
Ea18.value_counts()
#df18 열에 taiwan = 0을 추가 해야 합니다.


df17_Ea = df17[df17['Country'].isin(EastAsia)]
Ea17= (df17_Ea['Country'].replace("People 's Republic of China",'China')
.value_counts().to_frame().reset_index()
.rename(columns={'index':'Country', 'Country':'17'}))

#data를 합쳐서 하나의 dataframe으로 만들어 줌.

df5years = pd.merge(Ea17, Ea18, on='Country', how='outer')
df5year =pd.merge(Ea19,Ea20, on='Country', how='outer')
df5year=pd.merge(df5year, Ea21, on='Country', how='outer')

df5years = pd.merge(df5years, df5year, on='Country', how='outer')


fig = go.Figure(data=[
go.Bar(name='2017', x=df5years['Country'], y=df5years['17']),
go.Bar(name='2018', x=df5years['Country'], y=df5years['18']),
go.Bar(name='2019', x=df5years['Country'], y=df5years['19']),
go.Bar(name='2020', x=df5years['Country'], y=df5years['20']),
go.Bar(name='2021', x=df5years['Country'], y=df5years['21'])
])

#Change the bar mode
fig.update_layout(barmode='stack', title='연도별 동아시아 Kaggle 사용자수'
)
fig.show()


# Text : percent

5년간 china의 Kaggle 응답자 수가 가장 많았다. taiwan이 가장 적지만, 2018년도에 어떤이유인지 모르겠지만, china로 결과 값이 흡수 된 것 같다.

south korea나 Taiwan의 응답자수는 china의 절반에 미치지 못한다.

  • 인구수 대비 몇 % 가 많다.

3. Kaggle Gender (W/Ea)

3.1 data 전처리

3.2 그래프 그리기

1
2
3
4
5
6
7
8
9
10
11
12
13
14
15
16
17
18
19
20
21
22
23
24
25
26
27
28
29
30
31
32
33
34
35
36
37
38
39
40
41
42
43
44
45
46
47
48
49
50
51
52
53
54
55
56
57
58
59
60
61
62
63
64
65
66
67
68
69
70
71
72
73
74
75
76
77
78
79
80
81
82
83
84
85
Gender_17 = (
df17['GenderSelect']
.replace(['A different identity', 'Prefer to self-describe', 'Non-binary, genderqueer, or gender non-conforming'], 'Others')
.fillna('Others')
.value_counts()
.to_frame()
.reset_index()
.rename(columns={'index':'type', 'GenderSelect':'Gender'})
.groupby('type')
.sum()
.reset_index()
)
Gender_18 = (
df18['Q1']
.replace(['Prefer not to say', 'Prefer to self-describe'], 'Others')
.fillna('Others')
.value_counts()
.to_frame()
.reset_index()
.rename(columns={'index':'type', 'Q1':'Gender'})
.groupby('type')
.sum()
.reset_index()
)
Gender_19 = (
df19['Q2']
.replace(['Prefer not to say','Prefer to self-describe'],'Others')
.fillna('Others')
.value_counts()
.to_frame()
.reset_index()
.rename(columns={'index':'type', 'Q2':'Gender'})
.groupby('type')
.sum()
.reset_index()
)
Gender_20 = (
df20['Q2']
.replace(['Prefer not to say', 'Prefer to self-describe', 'Nonbinary'], 'Others')
.replace(['Man', 'Woman'], ['Male', 'Female'])
.fillna('Others')
.value_counts()
.to_frame()
.reset_index()
.rename(columns={'index':'type', 'Q2':'Gender'})
.groupby('type')
.sum()
.reset_index()
)
Gender_21 = (
df21['Q2']
.replace(['Prefer not to say', 'Prefer to self-describe', 'Nonbinary'], 'Others')
.replace(['Man', 'Woman'], ['Male', 'Female'])
.fillna('Others')
.value_counts()
.to_frame()
.reset_index()
.rename(columns={'index':'type', 'Q2':'Gender'})
.groupby('type')
.sum()
.reset_index()
)

# Create subplots: use 'domain' type for Pie subplot
fig = make_subplots(rows=1, cols=5, specs=[[{'type':'domain'}, {'type':'domain'}, {'type':'domain'}, {'type':'domain'}, {'type':'domain'}]],
subplot_titles=("2017", "2018", "2019", "2020", "2021"))
fig.add_trace(go.Pie(labels=Gender_21['type'], values=Gender_21['Gender'], name="2021", scalegroup='one'),
1, 5)
fig.add_trace(go.Pie(labels=Gender_20['type'], values=Gender_20['Gender'], name="2020", scalegroup='one'),
1, 4)
fig.add_trace(go.Pie(labels=Gender_19['type'], values=Gender_19['Gender'], name="2019", scalegroup='one'),
1, 3)
fig.add_trace(go.Pie(labels=Gender_18['type'], values=Gender_18['Gender'], name="2018", scalegroup='one'),
1, 2)
fig.add_trace(go.Pie(labels=Gender_17['type'], values=Gender_17['Gender'], name="2017", scalegroup='one'),
1, 1)

# Use `hole` to create a donut-like pie chart
fig.update_traces(hole=.2, hoverinfo="label+percent+name")
fig.update_layout(
title_text="<b>World_Gender</b>",
# Add annotations in the center of the donut pies.
)
fig.show()

연도별, 지역별로 보았을때, 여성의 비율이 20% 미만으로 적은 것을 알 수 있다.

2019년 이전보다 2020년 이후가 증가 했다. (16%-> 19%)

0. Kaggle job (W/Ea)

0.1 data 전처리

0.2 그래프 그리기

1
2
3
4
5
6
7
8
9
10
11
12
13
14
15
16
17
18
19
20
21
22
23
24
25
26
27
28
29
30
31
32
33
34
35
36
37
38
39
40
41
42
43
44
45
46
47
48
49
50
51
52
53
54
55
56
57
58
59
60
61
62
63
64
65
66
67
68
69
70
71
72
73
74
75
76
77
78
79
80
81
82
83
84
85
86
87
88
89
90
91
92
93
#data 확인
Data_Analyst =['Data Analyst','Data Miner,Information technology','Data Miner',
'Predictive Modeler','Information technology, networking, or system administration',
'A business discipline (accounting, economics, finance, etc.)', 'Business Analyst', 'Humanities',
'Statistician', 'Mathematics or statistics', 'Medical or life sciences (biology, chemistry, medicine, etc.)',
'Physics or astronomy', 'Research Scientist', 'Researcher', 'Social sciences (anthropology, psychology, sociology, etc.)',
'Humanities (history, literature, philosophy, etc.)']
Data_Scientist =['Data Scientist', 'Environmental science or geology',
'Machine Learning Engineer', 'Scientist/Researcher']
Developer=['Developer Relations/Advocacy','Data Engineer','Engineer','Engineering (non-computer focused)',
'Programmer','Software Engineer', 'Computer Scientist','Computer science (software engineering, etc.)',
'Fine arts or performing arts','Product Manager', 'Software Developer/Software Engineer',
'Product/Project Manager','Program/Project Manager','DBA/Database Engineer']
Not_Employeed =['Currently not employed', 'Not employed', 'Student']
Others = ['I never declared a major', 'Other']


#연도별로 뽑은 나라별 직업.
df21job_Ea = df21_Ea.loc[:,['Q3','Q5']].reset_index().rename(columns={'index':'job', 'Q5':'2021'}).fillna('Other')
df20job_Ea = df20_Ea.loc[:,['Q3','Q5']].reset_index().rename(columns={'index':'job', 'Q5':'2020'}).fillna('Other')
df19job_Ea = df19_Ea.loc[:,['Q3','Q5']].reset_index().rename(columns={'index':'job', 'Q5':'2019'}).fillna('Other')
df18job_Ea = df18_Ea.loc[:,['Q3','Q5']].reset_index().rename(columns={'index':'job', 'Q5':'2018'}).fillna('Other')
df17job_Ea = df17_Ea.loc[:,['Country','CurrentJobTitleSelect']].reset_index().rename(columns={'index':'job', 'CurrentJobTitleSelect':'2017'}).fillna('Other')

# 연도별 job Grouping in east asia

df21job_Ea.value_counts('2021')
df21job_Ea['JOB']=["Data Analyst" if x in Data_Analyst
else "Data Scientist" if x in Data_Scientist # Data Scientist
else "Data Engineer" if x in Developer
else "NotEmployeed" if x in Not_Employeed
else "Others"
for x in df21job_Ea['2021']]
df21job_Ea.value_counts('JOB')

df20job_Ea.value_counts('2020')
df20job_Ea['JOB']=["Data Analyst" if x in Data_Analyst
else "Data Scientist" if x in Data_Scientist
else "Data Engineer" if x in Developer
else "NotEmployeed" if x in Not_Employeed
else "Other"
for x in df20job_Ea['2020']]
df20job_Ea[['2020','JOB']]

df19job_Ea.value_counts('2019')
df19job_Ea['JOB']=["Data Analyst" if x in Data_Analyst
else "Data Scientist" if x in Data_Scientist
else "Data Engineer" if x in Developer
else "NotEmployeed" if x in Not_Employeed
else "Other"
for x in df19job_Ea['2019']]


#2019 data에 "Other" grouping이 제대로 이루어 졌는지 확인
df19jobTest = df19job_Ea.loc[df19job_Ea.JOB == 'Other']
df19jobTest['2019'].value_counts()


df18job_Ea.value_counts('2018')
df18job_Ea['JOB']=["Data Analyst" if x in Data_Analyst
else "Data Scientist" if x in Data_Scientist
else "Data Engineer" if x in Developer
else "NotEmployeed" if x in Not_Employeed
else "Other"
for x in df18job_Ea['2018']]

df18jobTest = df18job_Ea.loc[df18job_Ea.JOB == 'Other']
df18jobTest['2018'].value_counts()


df17job_Ea.value_counts('2017')
df17job_Ea['JOB']=["Data Analyst" if x in Data_Analyst
else "Data Scientist" if x in Data_Scientist
else "Data Engineer" if x in Developer
else "NotEmployeed" if x in Not_Employeed
else "Other"
for x in df17job_Ea['2017']]

df17jobTest = df17job_Ea.loc[df17job_Ea.JOB == 'Other']
df17jobTest['2017'].value_counts()


df21jobTest = df21job_Ea.loc[df21job_Ea.JOB == 'Other']
df21jobTest['2021'].head()
df21job_Ea.value_counts('JOB')

#data frame 정리
dfjob21 =df21job_Ea.groupby(['Q3','JOB']).size().reset_index().rename(columns = {0:"Count"}).rename(columns={'Q3':'country', 'JOB':'2021'})
dfjob20 =df20job_Ea.groupby(['Q3','JOB']).size().reset_index().rename(columns = {0:"Count"}).rename(columns={'Q3':'country', 'JOB':'2020'})
dfjob19 =df19job_Ea.groupby(['Q3','JOB']).size().reset_index().rename(columns = {0:"Count"}).rename(columns={'Q3':'country', 'JOB':'2019'})
dfjob18 =df18job_Ea.groupby(['Q3','JOB']).size().reset_index().rename(columns = {0:"Count"}).rename(columns={'Q3':'country', 'JOB':'2018'})
dfjob17 =df17job_Ea.groupby(['Country','JOB']).size().reset_index().rename(columns = {0:"Count"}).rename(columns={'Country':'country', 'JOB':'2017'})

1
2
3
4
5
6
7
8
9
10
11
12
13
14
15
16
17
18
19
20
21
22
23
24
25
26
27
28
29
30
31
32
33
34
35
36
37
38
39
40
41
42
43
44
45
46
47
48
49
50
51
52
53
54
55
56
57
58
59
60
61
62
63
64
65
66
67
68
69
70
71
72
73
74
75
#21년도 Bar graph 그리기
fig = go.Figure()

for country, group in dfjob21.groupby('country'):
fig.add_trace(go.Bar(
x = group['2021'], y = group['Count'], name = country
))
fig.update_layout(barmode="group",
plot_bgcolor = "white",
title='2021_나라별 직업 수',
width=700,
height=450
)
fig.show()

#20년도 Bar graph 그리기
fig = go.Figure()

for country, group in dfjob20.groupby('country'):
fig.add_trace(go.Bar(
x = group['2020'], y = group['Count'], name = country
))
fig.update_layout(barmode="group",
plot_bgcolor = "white",
title='2020_나라별 직업 수',
width=700,
height=450)

fig.show()

#19년도 Bar graph 그리기
fig = go.Figure()

for country, group in dfjob19.groupby('country'):
fig.add_trace(go.Bar(
x = group['2019'], y = group['Count'], name = country
))
fig.update_layout(barmode="group",
plot_bgcolor = "white",
title='2019_나라별 직업 수',
width=700,
height=450
)

fig.show()

#18년도 Bar graph 그리기
fig = go.Figure()

for country, group in dfjob18.groupby('country'):
fig.add_trace(go.Bar(
x = group['2018'], y = group['Count'], name = country
))
fig.update_layout(barmode="group",
plot_bgcolor = "white",
title='2018_나라별 직업 수', width=700,
height=450
)
fig.show()


#17년도 Bar graph 그리기
fig = go.Figure()

for country, group in dfjob17.groupby('country'):
fig.add_trace(go.Bar(
x = group['2017'], y = group['Count'], name = country
))
fig.update_layout(barmode="group",
plot_bgcolor = "white",
title='2017_나라별 직업 수',
width=700,
height=450
)
fig.show()

0. Kaggle age & Edu (W/Ea)

0.1 data 전처리

0.2 그래프 그리기

1
2
3
4
5
6
7
8
9
10
11
12
13
14
15
16
17
18
19
20
21
22
23
24
25
26
27
28
29
30
31
32
33
34
35
36
37
38
39
40
41
42
43
44
45
46
47
48
49
50
51
52
53
54
55
56
57
58
59
60
61
62
63
64
65
66
67
68
69
70
71
72
73
74
75
76
77
78
79
80
81
82
83
84
85
86
87
88
89
90
# 연도별 나이 
df21Age_Ea = df21_Ea.loc[:,['Q3','Q1']].reset_index().rename(columns={'Q3':'East_Asia', 'Q1':'2021'}).fillna('etc')
df20Age_Ea = df20_Ea.loc[:,['Q3','Q1']].reset_index().rename(columns={'Q3':'East_Asia', 'Q1':'2020'}).fillna('etc')
df19Age_Ea = df19_Ea.loc[:,['Q3','Q1']].reset_index().rename(columns={'Q3':'East_Asia', 'Q1':'2019'}).fillna('etc')
df18Age_Ea = df18_Ea.loc[:,['Q3','Q2']].reset_index().rename(columns={'Q3':'East_Asia', 'Q2':'2018'}).fillna('etc')
df17Age_Ea = df17_Ea.loc[:,['Country','Age']].reset_index().rename(columns={'Country':'East_Asia', 'Age':'2017'}).fillna('etc')

#data frame 정리
dfAge21 =df21Age_Ea.groupby(['East_Asia','2021']).size().reset_index().rename(columns = {0:"Count"})
dfAge20 =df20Age_Ea.groupby(['East_Asia','2020']).size().reset_index().rename(columns = {0:"Count"})
dfAge19 =df19Age_Ea.groupby(['East_Asia','2019']).size().reset_index().rename(columns = {0:"Count"})
dfAge18 =df18Age_Ea.groupby(['East_Asia','2018']).size().reset_index().rename(columns = {0:"Count"})
dfAge17 =(df17Age_Ea.groupby(['East_Asia','2017'])
.size().reset_index().rename(columns = {0:"Count"}))

#2017data
# array([16.0, 18.0, 19.0, 20.0, 21.0, 22.0, 23.0, 24.0, 25.0, 26.0, 27.0,
# 28.0, 29.0, 30.0, 31.0, 32.0, 33.0, 34.0, 35.0, 36.0, 37.0, 38.0,
# 39.0, 40.0, 41.0, 42.0, 43.0, 44.0, 45.0, 47.0, 50.0, 54.0, 100.0,
# 'etc', 46.0, 48.0, 49.0, 51.0, 52.0, 53.0, 55.0, 57.0, 58.0, 59.0,
# 62.0, 64.0, 65.0, 67.0, 68.0, 70.0, 17.0, 56.0, 60.0], dtype=object)


#21년도 Bar graph 그리기
fig = go.Figure()

for country, group in dfAge21.groupby('East_Asia'):
fig.add_trace(go.Bar(
x = group['2021'], y = group['Count'], name = country
))
fig.update_layout(barmode="group",
plot_bgcolor = "white",
title='2021_나라별 연령')
fig.show()

#20년도 Bar graph 그리기
fig = go.Figure()

for country, group in dfAge20.groupby('East_Asia'):
fig.add_trace(go.Bar(
x = group['2020'], y = group['Count'], name = country
))
fig.update_layout(barmode="group",
plot_bgcolor = "white",
title='2020_나라별 연령')

fig.show()

#19년도 Bar graph 그리기
fig = go.Figure()

for country, group in dfAge19.groupby('East_Asia'):
fig.add_trace(go.Bar(
x = group['2019'], y = group['Count'], name = country
))
fig.update_layout(barmode="group",
plot_bgcolor = "white",
title='2019_나라별 연령')

fig.show()


#18년도 Bar graph 그리기
fig = go.Figure()

for country, group in dfAge18.groupby('East_Asia'):
fig.add_trace(go.Bar(
x = group['2018'], y = group['Count'], name = country
))
fig.update_layout(barmode="group",
plot_bgcolor = "white",
title='2018_나라별 연령')

fig.show()


#17년도 Bar graph 그리기_ Scatter 로 변경
fig = go.Figure()

for country, group in dfAge17.groupby('East_Asia'):
fig.add_trace(go.Bar(
x = group['2017'], y = group['Count'], name = country
))
fig.update_layout(barmode="group",
plot_bgcolor = "white",
title='2017_나라별 연령')

fig.show()


0.2 Kaggle age (Ea)

0.1.1 data 전처리

0.2.1 그래프 그리기

1
2
3
4
5
6
7
8
9
10
11
12
13
14
15
16
17
18
19
20
21
22
23
24
25
26
27
28
29
30
31
32
33
#data frame 정리

dfAge21_percent =df21Age_Ea.groupby(['East_Asia','2021']).size().reset_index().rename(columns = {0:"Count"})
dfAge21_percent['percent'] =((dfAge21_percent['Count'] / len(df21Age_Ea))*100).round(2)
dfAge21_percent['percent_str'] =((dfAge21_percent['Count'] / len(df21Age_Ea))*100).round(2).astype(str) + '%'
# dfAge21['percent'] = ((media['Count'] / len(df))*100).round(2).astype(str) + '%'
# dfAge_percent21=dfAge21.value_counts('East_Asia',normalize=True).mul(100).round(1).astype(str)
dfAge21_percent


# 나라별 연령대 비율 in East Asia
fig = go.Figure()
for country, group in dfAge21_percent.groupby('East_Asia'):
fig.add_trace(go.Bar(
x = group['2021'], y = group['percent'], name = country, text=group['percent_str']
))
fig.update_layout(barmode="stack",
plot_bgcolor = "white",
title='2021_ 연령별 나라 비율 in East Asia')
fig.show()


# 연령별 나라 비율 in East Asia // 다중 pie 그래프로 바꾸기
fig = go.Figure()

for country, group in dfAge21_percent.groupby('2021'):
fig.add_trace(go.Bar(
x = group['East_Asia'], y =group['percent'], text=dfAge21_percent['percent_str']
))
fig.update_layout(barmode="stack",
plot_bgcolor = "white",
title='2021_ 나라별 연령 비율 in East Asia')
fig.show()

연도별 연령

1
2
3
4
5
6
7
8
9
10
11
12
13
14
15
16
17
18
19
20
21
22
23
24
25
26
27
28
29
30
31
32
33
34
35
36
37
38
39
40
41
42
43
44
45
46
47
# 나라별로 연도가 나왓으면 좋겠어요 .

z = df21Age_Ea.groupby(['East_Asia', '2021']).size().unstack().fillna(0).astype('int64')
z_data = z.apply(lambda x:np.round(x/x.sum(), 2), axis = 1).to_numpy() # convert to correlation matrix
x = z.columns.tolist()
y = z.index.tolist()

fig21 = ff.create_annotated_heatmap(z_data, x = x, y = y, colorscale = "sunset")

z = df20Age_Ea.groupby(['East_Asia', '2020']).size().unstack().fillna(0).astype('int64')
z_data = z.apply(lambda x:np.round(x/x.sum(), 2), axis = 1).to_numpy() # convert to correlation matrix
x = z.columns.tolist()
y = z.index.tolist()

fig20 = ff.create_annotated_heatmap(z_data, x = x, y = y, colorscale = "sunset")


z = df19Age_Ea.groupby(['East_Asia', '2019']).size().unstack().fillna(0).astype('int64')
z_data = z.apply(lambda x:np.round(x/x.sum(), 2), axis = 1).to_numpy() # convert to correlation matrix
x = z.columns.tolist()
y = z.index.tolist()

fig19 = ff.create_annotated_heatmap(z_data, x = x, y = y, colorscale = "sunset")


z = df18Age_Ea.groupby(['East_Asia', '2018']).size().unstack().fillna(0).astype('int64')
z_data = z.apply(lambda x:np.round(x/x.sum(), 2), axis = 1).to_numpy() # convert to correlation matrix
x = z.columns.tolist()
y = z.index.tolist()

fig18 = ff.create_annotated_heatmap(z_data, x = x, y = y, colorscale = "sunset")


z = df17Age_Ea.groupby(['East_Asia', '2017']).size().unstack().fillna(0).astype('int64')
z_data = z.apply(lambda x:np.round(x/x.sum(), 2), axis = 1).to_numpy() # convert to correlation matrix
x = z.columns.tolist()
y = z.index.tolist()

fig17 = ff.create_annotated_heatmap(z_data, x = x, y = y, colorscale = "sunset")


fig21.show()
fig20.show()
fig19.show()
fig18.show()

연령별 지역

1
2
3
4
5
6
7
8
9
10
11
12
13
14
15
16
17
18
19
20
21
22
23
24
25
26
27
28
29
30
31
32
33
34
35
36
37
38
39
40
41
42
# 연령-지역 %
dfKo_Age21= df21Age_Ea[df21Age_Ea['East_Asia']=='South Korea']
dfKo_Age21_per=dfKo_Age21['2021'].value_counts().to_frame().reset_index()
dfKo_Age21_per['South Korea']=((dfKo_Age21_per['2021'] / len(dfKo_Age21))*100).round(2)

dfTw_Age21= df21Age_Ea[df21Age_Ea['East_Asia']=='Taiwan']
dfTw_Age21_per=dfTw_Age21['2021'].value_counts().to_frame().reset_index()
dfTw_Age21_per['Taiwan']=((dfTw_Age21_per['2021'] / len(dfTw_Age21))*100).round(2)
dfTw_Age21_per

dfCh_Age21= df21Age_Ea[df21Age_Ea['East_Asia']=='China']
dfCh_Age21_per=dfCh_Age21['2021'].value_counts().to_frame().reset_index()
dfCh_Age21_per['China']=((dfCh_Age21_per['2021'] / len(dfCh_Age21))*100).round(2)
dfCh_Age21_per

df21Age_Ea.head()
dfJp_Age21= df21Age_Ea[df21Age_Ea['East_Asia']=='Japan']
dfJp_Age21_per=dfJp_Age21['2021'].value_counts().to_frame().reset_index()
dfJp_Age21_per['Japan']=((dfJp_Age21_per['2021'] / len(dfJp_Age21))*100).round(2)
dfJp_Age21_per


#g 그리기(heatMap)
merge1= pd.merge(dfKo_Age21_per,dfTw_Age21_per, on='index', how='outer')
merge2= pd.merge(dfCh_Age21_per,dfJp_Age21_per, on='index', how='outer')
merge= pd.merge(merge1,merge2, on='index', how='outer').fillna(0).sort_values(by=['index'],ascending=True)

merge.iloc[:,[2,4,6,8]]
merge.iloc[:,[2,4,6,8]].to_numpy()


fig = go.Figure(data=go.Heatmap(
z=merge.iloc[:,[2,4,6,8]].to_numpy(),
x=['South Korea','Taiwan','China','Japan'],
y=merge.sort_values(by=['index'],ascending=True)['index'].tolist(),
hoverongaps = False,
opacity=1.0, xgap=2.5, ygap=2.5, colorscale='orrd'),
)
fig.show()

0.2 Kaggle Edu (Ea)

0.1.1 data 전처리

0.2.1 그래프 그리기

1
2
3
4
5
6
7
8
9
10
11
12
13
14
15
16
17
18
19
20
21
22
23
24
25
26
27
28
29
30
31
32
33
34
35
36
37
38
39
40
41
42
43
44
# 연도별 학력
df21Edu_Ea = df21_Ea.loc[:,['Q3','Q4']].reset_index().rename(columns={'Q3':'East_Asia', 'Q4':'2021'}).fillna('etc')
df20Edu_Ea = df20_Ea.loc[:,['Q3','Q4']].reset_index().rename(columns={'Q3':'East_Asia', 'Q4':'2020'}).fillna('etc')
df19Edu_Ea = df19_Ea.loc[:,['Q3','Q4']].reset_index().rename(columns={'Q3':'East_Asia', 'Q4':'2019'}).fillna('etc')
df18Edu_Ea = df18_Ea.loc[:,['Q3','Q4']].reset_index().rename(columns={'Q3':'East_Asia', 'Q4':'2018'}).fillna('etc')
df17Edu_Ea = df17_Ea.loc[:,['Country','FormalEducation']].reset_index().rename(columns={'Country':'East_Asia', 'FormalEducation':'2017'}).fillna('etc')

df21Edu_Ea =df21Edu_Ea.replace({'I prefer not to answer':'etc'}).sort_values(by='2021', ascending=False)
df20Edu_Ea =df20Edu_Ea.replace({'I prefer not to answer':'etc'}).sort_values(by='2020', ascending=False)
df19Edu_Ea =df19Edu_Ea.replace({'I prefer not to answer':'etc'}).sort_values(by='2019', ascending=False)
df18Edu_Ea =df18Edu_Ea.replace({'I prefer not to answer':'etc'}).sort_values(by='2018', ascending=False)
df17Edu_Ea =df17Edu_Ea.replace({'I prefer not to answer':'etc'}).sort_values(by='2017', ascending=False)

#data frame 정리
dfEdu21 =df21Edu_Ea.groupby(['East_Asia','2021']).size().reset_index().rename(columns = {0:"Count"})
dfEdu20 =df20Edu_Ea.groupby(['East_Asia','2020']).size().reset_index().rename(columns = {0:"Count"})
dfEdu19 =df19Edu_Ea.groupby(['East_Asia','2019']).size().reset_index().rename(columns = {0:"Count"})
dfEdu18 =df18Edu_Ea.groupby(['East_Asia','2018']).size().reset_index().rename(columns = {0:"Count"})
dfEdu17 =(df17Edu_Ea.groupby(['East_Asia','2017'])
.size().reset_index().rename(columns = {0:"Count"}))

# 비율 data 추가
##21
dfEdu21_percent =df21Edu_Ea.groupby(['East_Asia','2021']).size().reset_index().rename(columns = {0:"Count"})
dfEdu21_percent['percent'] =((dfEdu21_percent['Count'] / len(df21Edu_Ea))*100).round(2)
dfEdu21_percent['percent_str'] =((dfEdu21_percent['Count'] / len(df21Edu_Ea))*100).round(2).astype(str) + '%'
##20
dfEdu20_percent =df20Edu_Ea.groupby(['East_Asia','2020']).size().reset_index().rename(columns = {0:"Count"})
dfEdu20_percent['percent'] =((dfEdu20_percent['Count'] / len(df20Edu_Ea))*100).round(2)
dfEdu20_percent['percent_str'] =((dfEdu20_percent['Count'] / len(df20Edu_Ea))*100).round(2).astype(str) + '%'
##19
dfEdu19_percent =df19Edu_Ea.groupby(['East_Asia','2019']).size().reset_index().rename(columns = {0:"Count"})
dfEdu19_percent['percent'] =((dfEdu19_percent['Count'] / len(df19Edu_Ea))*100).round(2)
dfEdu19_percent['percent_str'] =((dfEdu19_percent['Count'] / len(df19Edu_Ea))*100).round(2).astype(str) + '%'
##18
dfEdu18_percent =df18Edu_Ea.groupby(['East_Asia','2018']).size().reset_index().rename(columns = {0:"Count"})
dfEdu18_percent['percent'] =((dfEdu18_percent['Count'] / len(df18Edu_Ea))*100).round(2)
dfEdu18_percent['percent_str'] =((dfEdu18_percent['Count'] / len(df18Edu_Ea))*100).round(2).astype(str) + '%'
##19
dfEdu17_percent =df17Edu_Ea.groupby(['East_Asia','2017']).size().reset_index().rename(columns = {0:"Count"})
dfEdu17_percent['percent'] =((dfEdu17_percent['Count'] / len(df17Edu_Ea))*100).round(2)
dfEdu17_percent['percent_str'] =((dfEdu17_percent['Count'] / len(df17Edu_Ea))*100).round(2).astype(str) + '%'


1
2
3
4
5
6
7
8
9
10
11
12
13
14
15
16
17
18
19
20
21
22
23
24
25
26
27
28
29
30
31
32
33
34
35
36
37
38
39
40
41
42
43
44
45
46
47
48
49
50
51
52
53
54
55
56
57
58
59
60
61
62
63
64
65
66
67

#21년도 Bar graph 그리기
fig = go.Figure()

for country, group in dfEdu21_percent.groupby('East_Asia'):
fig.add_trace(go.Bar(
x = group['2021'], y = group['percent'], name = country
))
fig.update_layout(barmode="group",
plot_bgcolor = "white",
title='2021_나라별 학력')
fig.show()

#20년도 Bar graph 그리기
fig = go.Figure()

for country, group in dfEdu20_percent.groupby('East_Asia'):
fig.add_trace(go.Bar(
x = group['2020'], y = group['percent'], name = country
))
fig.update_layout(barmode="group",
plot_bgcolor = "white",
title='2020_나라별 학력')

fig.show()

#19년도 Bar graph 그리기
fig = go.Figure()

for country, group in dfEdu19_percent.groupby('East_Asia'):
fig.add_trace(go.Bar(
x = group['2019'], y = group['percent'], name = country
))
fig.update_layout(barmode="group",
plot_bgcolor = "white",
title='2019_나라별 학력')

fig.show()


#18년도 Bar graph 그리기
fig = go.Figure()

for country, group in dfEdu18_percent.groupby('East_Asia'):
fig.add_trace(go.Bar(
x = group['2018'], y = group['percent'], name = country
))
fig.update_layout(barmode="group",
plot_bgcolor = "white",
title='2018_나라별 학력')

fig.show()


#17년도 Bar graph 그리기
fig = go.Figure()

for country, group in dfEdu17_percent.groupby('East_Asia'):
fig.add_trace(go.Bar(
x = group['2017'], y = group['percent'], name = country
))
fig.update_layout(barmode="group",
plot_bgcolor = "white",
title='2017_나라별 학력')

fig.show()

1
2
3
4
5
6
7
8
9
10
11
12
13
14
15
16
17
18
19
20
21
22
23
24
25
26
27
28
29
30
31
32
33
34
35
36
37
38
39
40
41
42
43
44
45
46
47
48
49
50
51
52
53
54
55
56
57
58
59
60
61
62
63
64
65
66
67

#21년도 Bar graph 그리기
fig = go.Figure()

for country, group in dfEdu21_percent.groupby('East_Asia'):
fig.add_trace(go.Bar(
x = group['2021'], y = group['Count'], name = country
))
fig.update_layout(barmode="stack",
plot_bgcolor = "white",
title='2021_나라별 학력 비율 ')
fig.show()

#20년도 Bar graph 그리기
fig = go.Figure()

for country, group in dfEdu20_percent.groupby('East_Asia'):
fig.add_trace(go.Bar(
x = group['2020'], y = group['Count'], name = country
))
fig.update_layout(barmode="stack",
plot_bgcolor = "white",
title='2020_나라별 학력 비율 ')

fig.show()

#19년도 Bar graph 그리기
fig = go.Figure()

for country, group in dfEdu19_percent.groupby('East_Asia'):
fig.add_trace(go.Bar(
x = group['2019'], y = group['Count'], name = country
))
fig.update_layout(barmode="stack",
plot_bgcolor = "white",
title='2019_나라별 학력 비율 ')

fig.show()


#18년도 Bar graph 그리기
fig = go.Figure()

for country, group in dfEdu18_percent.groupby('East_Asia'):
fig.add_trace(go.Bar(
x = group['2018'], y = group['Count'], name = country
))
fig.update_layout(barmode="stack",
plot_bgcolor = "white",
title='2018_나라별 학력 비율 ')

fig.show()


#17년도 Bar graph 그리기
fig = go.Figure()

for country, group in dfEdu17_percent.groupby('East_Asia'):
fig.add_trace(go.Bar(
x = group['2017'], y = group['Count'], name = country
))
fig.update_layout(barmode="stack",
plot_bgcolor = "white",
title='2017_나라별 학력 비율 ')

fig.show()

1
2
3
4
5
6
7
8

z = df21_Ea.groupby(['Q4', 'Q1']).size().unstack().fillna(0).astype('int64')
z_data = z.apply(lambda x:np.round(x/x.sum(), 2), axis = 1).to_numpy() # convert to correlation matrix
x = z.columns.tolist()
y = z.index.tolist()

fig = ff.create_annotated_heatmap(z_data, x = x, y = y, colorscale = "sunset")
fig.show()

경력

1
2
3
4
5
6
7
8
9
10
11
12
13
14
15
16
17
18
19
20
21
22
23
24
#전체 코드
_3year = ['I have never written code', '< 1 years', '1-3 years']
_5year = ['3-5 years ','5-10 years']
_10year = ['10-20 years','20+ years']

df21_3year = df21['Q6'][df21['Q6'].isin(_3year)]
df21_5year = df21['Q6'][df21['Q6'].isin(_5year)]
df21_10year = df21['Q6'][df21['Q6'].isin(_10year)]

df21_3year.count()
df21_5year.count()
df21_10year.count()

years =['_3year','_5year', '_10year']
values =[df21_3year.count(),
df21_5year.count(),
df21_10year.count()]

fig = go.Figure(data=[
go.Bar(name='21년 World kaggler들의 경력', x=years, y=values ,orientation='v'),])

fig.update_layout(title_text="<b>21년 World kaggler들의 경력</b>",title_font_size=35)

fig.show()
1
2
3
4
5
6
7
8
9
10
11
12
13
14
15
16
17
18
19
20
21
22
23
24
25
26
27
28
29
30
#최종 합친 코드
_3year = ['I have never written code', '< 1 years', '1-3 years']
_5year = ['3-5 years ','5-10 years']
_10year = ['10-20 years','20+ years']

df21_Ea_3year = df21_Ea['Q3'][df21_Ea['Q6'].isin(_3year)].value_counts().to_frame().rename(columns = {'Q3':'3year'})
df21_Ea_5year = df21_Ea['Q3'][df21_Ea['Q6'].isin(_5year)].value_counts().to_frame().rename(columns = {'Q3':'5year'})
df21_Ea_10year = df21_Ea['Q3'][df21_Ea['Q6'].isin(_10year)].value_counts().to_frame().rename(columns = {'Q3':'10year'})

career=(df21_Ea_3year.join(df21_Ea_5year).join(df21_Ea_10year))
career

career.iloc[0,0:3] #China
career.iloc[1,0:3] #Japan
career.iloc[2,0:3] #South Korea
career.iloc[3,0:3] #Taiwan

fig = go.Figure(data=[
go.Bar(name='China', x = years,
y=career.iloc[0,0:3]),
go.Bar(name='Japan', x = years,
y=career.iloc[1,0:3]),
go.Bar(name='South Korea', x= years,
y=career.iloc[2,0:3]),
go.Bar(name='Taiwan', x= years,
y=career.iloc[3,0:3])
])

fig.update_layout(title_text="<b>21년 EastAisa kaggler들의 경력</b>",title_font_size=35)
fig.show()

연봉

1
2
3
4
5
6
7
8
9
10
11
12
13
14
#전체 코드

#마지막 행 삭제해줌
df21_=(df21['Q25'].value_counts().to_frame())
#df21_=df21_.drop(df21_.index[26])
#df21_

compensation = df21_['Q25'].index
fig = go.Figure(data=[
go.Bar(name='21년 World kaggler들의 연봉', x=compensation, y=df21_['Q25'].to_numpy() ,orientation='v')])

fig.update_layout(title_text="<b>21년 World kaggler들의 연봉</b>",title_font_size=35)

fig.show()
1
2
3
4
5
6
7
8
9
10
11
12
13
14
15
16
17
18
compensation = df21_['Q25'].index

fig = go.Figure(data=[
go.Bar(name='China', x = compensation,
y = df21_Ea['Q25'][df21_Ea['Q3'] =='Japan'].value_counts()),

go.Bar(name='Japan', x = compensation,
y=df21_Ea['Q25'][df21_Ea['Q3'] =='Taiwan'].value_counts()),

go.Bar(name='South Korea', x = compensation,
y=df21_Ea['Q25'][df21_Ea['Q3'] =='South Korea'].value_counts()),

go.Bar(name='Taiwan', x = compensation,
y=df21_Ea['Q25'][df21_Ea['Q3'] =='China'].value_counts())
])

fig.update_layout(title_text="<b>21년 EastAisa kaggler들의 연봉</b>",title_font_size=35)
fig.show()

언어

1
df21['Q7_Part_1'].value_counts()
Python    21860
Name: Q7_Part_1, dtype: int64
1
2
3
4
5
6
7
8
9
10
11
12
13
14
15
16
17
18
19
20
21
22
23
24
25
26
27
28
29
30
31
32
33
34
35
36
37
#코드 전체

df21_p = df21['Q7_Part_1'].value_counts().to_frame() #python
df21_r = df21['Q7_Part_2'].value_counts().to_frame() #r
df21_s = df21['Q7_Part_3'].value_counts().to_frame() #sql
df21_c = df21['Q7_Part_4'].value_counts().to_frame() #c
df21_cc = df21['Q7_Part_5'].value_counts().to_frame() #c++
df21_j = df21['Q7_Part_6'].value_counts().to_frame() #java
df21_js = df21['Q7_Part_7'].value_counts().to_frame() #javascript
df21_ju = df21['Q7_Part_8'].value_counts().to_frame() #julia
df21_sw = df21['Q7_Part_9'].value_counts().to_frame() #swift
df21_b = df21['Q7_Part_10'].value_counts().to_frame() #bash
df21_ma = df21['Q7_Part_11'].value_counts().to_frame() #matlab
df21_n = df21['Q7_Part_12'].value_counts().to_frame() #none

languages = ['Python','R','SQL','C','C++','Java','Javascript','Julia','Swift','Bash','MATLAB','None']

fig = go.Figure(data=[
go.Bar(name='21년 World kaggler들이 사용하는 언어', x = languages,
y = [df21_p.iloc[0,0],
df21_r.iloc[0,0],
df21_s.iloc[0,0],
df21_c.iloc[0,0],
df21_cc.iloc[0,0],
df21_j.iloc[0,0],
df21_js.iloc[0,0],
df21_ju.iloc[0,0],
df21_sw.iloc[0,0],
df21_b.iloc[0,0],
df21_ma.iloc[0,0],
df21_n.iloc[0,0]],orientation='v')

])

fig.update_layout(title_text="<b>21년 World kaggler들이 사용하는 언어</b>",title_font_size=35)

fig.show()
1
2
3
4
5
6
7
8
9
10
11
12
13
14
15
16
17
18
19
20
21
22
23
24
25
26
27
28
29
30
31
32
33
34
35
36
37
38
39
40
41
42
43
44
45
46
47
48
49
50
51
52
53
54
55
56
57
58
59
60
61
62
63
64
65
66
67
68
69
70
71
72
73
74
75
76
77
78
79
80
df21_lan_ch_p=df21_Ea['Q7_Part_1'][df21_Ea['Q3']=='China'].value_counts().to_frame().rename(columns = {'Q7_Part_1':'cnt'})
df21_lan_ch_r=df21_Ea['Q7_Part_2'][df21_Ea['Q3']=='China'].value_counts().to_frame().rename(columns = {'Q7_Part_2':'cnt'})
df21_lan_ch_s=df21_Ea['Q7_Part_3'][df21_Ea['Q3']=='China'].value_counts().to_frame().rename(columns = {'Q7_Part_3':'cnt'})
df21_lan_ch_c=df21_Ea['Q7_Part_4'][df21_Ea['Q3']=='China'].value_counts().to_frame().rename(columns = {'Q7_Part_4':'cnt'})
df21_lan_ch_cc=df21_Ea['Q7_Part_5'][df21_Ea['Q3']=='China'].value_counts().to_frame().rename(columns = {'Q7_Part_5':'cnt'})
df21_lan_ch_j=df21_Ea['Q7_Part_6'][df21_Ea['Q3']=='China'].value_counts().to_frame().rename(columns = {'Q7_Part_6':'cnt'})
df21_lan_ch_js=df21_Ea['Q7_Part_7'][df21_Ea['Q3']=='China'].value_counts().to_frame().rename(columns = {'Q7_Part_7':'cnt'})
df21_lan_ch_ju=df21_Ea['Q7_Part_8'][df21_Ea['Q3']=='China'].value_counts().to_frame().rename(columns = {'Q7_Part_8':'cnt'})
df21_lan_ch_sw=df21_Ea['Q7_Part_9'][df21_Ea['Q3']=='China'].value_counts().to_frame().rename(columns = {'Q7_Part_9':'cnt'})
df21_lan_ch_b=df21_Ea['Q7_Part_10'][df21_Ea['Q3']=='China'].value_counts().to_frame().rename(columns = {'Q7_Part_10':'cnt'})
df21_lan_ch_ma=df21_Ea['Q7_Part_11'][df21_Ea['Q3']=='China'].value_counts().to_frame().rename(columns = {'Q7_Part_11':'cnt'})
df21_lan_ch_n=df21_Ea['Q7_Part_12'][df21_Ea['Q3']=='China'].value_counts().to_frame().rename(columns = {'Q7_Part_12':'cnt'})
ch_lan = pd.concat([df21_lan_ch_p,df21_lan_ch_r,df21_lan_ch_s,df21_lan_ch_c,df21_lan_ch_cc,df21_lan_ch_j,df21_lan_ch_js,df21_lan_ch_ju,df21_lan_ch_sw,df21_lan_ch_b,df21_lan_ch_ma,df21_lan_ch_n])


df21_lan_jp_p=df21_Ea['Q7_Part_1'][df21_Ea['Q3']=='Japan'].value_counts().to_frame().rename(columns = {'Q7_Part_1':'cnt'})
df21_lan_jp_r=df21_Ea['Q7_Part_2'][df21_Ea['Q3']=='Japan'].value_counts().to_frame().rename(columns = {'Q7_Part_2':'cnt'})
df21_lan_jp_s=df21_Ea['Q7_Part_3'][df21_Ea['Q3']=='Japan'].value_counts().to_frame().rename(columns = {'Q7_Part_3':'cnt'})
df21_lan_jp_c=df21_Ea['Q7_Part_4'][df21_Ea['Q3']=='Japan'].value_counts().to_frame().rename(columns = {'Q7_Part_4':'cnt'})
df21_lan_jp_cc=df21_Ea['Q7_Part_5'][df21_Ea['Q3']=='Japan'].value_counts().to_frame().rename(columns = {'Q7_Part_5':'cnt'})
df21_lan_jp_j=df21_Ea['Q7_Part_6'][df21_Ea['Q3']=='Japan'].value_counts().to_frame().rename(columns = {'Q7_Part_6':'cnt'})
df21_lan_jp_js=df21_Ea['Q7_Part_7'][df21_Ea['Q3']=='Japan'].value_counts().to_frame().rename(columns = {'Q7_Part_7':'cnt'})
df21_lan_jp_ju=df21_Ea['Q7_Part_8'][df21_Ea['Q3']=='Japan'].value_counts().to_frame().rename(columns = {'Q7_Part_8':'cnt'})
df21_lan_jp_sw=df21_Ea['Q7_Part_9'][df21_Ea['Q3']=='Japan'].value_counts().to_frame().rename(columns = {'Q7_Part_9':'cnt'})
df21_lan_jp_b=df21_Ea['Q7_Part_10'][df21_Ea['Q3']=='Japan'].value_counts().to_frame().rename(columns = {'Q7_Part_10':'cnt'})
df21_lan_jp_ma=df21_Ea['Q7_Part_11'][df21_Ea['Q3']=='Japan'].value_counts().to_frame().rename(columns = {'Q7_Part_11':'cnt'})
df21_lan_jp_n=df21_Ea['Q7_Part_12'][df21_Ea['Q3']=='Japan'].value_counts().to_frame().rename(columns = {'Q7_Part_12':'cnt'})
jp_lan = pd.concat([df21_lan_jp_p,df21_lan_jp_r,df21_lan_jp_s,df21_lan_jp_c,df21_lan_jp_cc,df21_lan_jp_j,df21_lan_jp_js,df21_lan_jp_ju,df21_lan_jp_sw,df21_lan_jp_b,df21_lan_jp_ma,df21_lan_jp_n])


df21_lan_tw_p=df21_Ea['Q7_Part_1'][df21_Ea['Q3']=='Taiwan'].value_counts().to_frame().rename(columns = {'Q7_Part_1':'cnt'})
df21_lan_tw_r=df21_Ea['Q7_Part_2'][df21_Ea['Q3']=='Taiwan'].value_counts().to_frame().rename(columns = {'Q7_Part_2':'cnt'})
df21_lan_tw_s=df21_Ea['Q7_Part_3'][df21_Ea['Q3']=='Taiwan'].value_counts().to_frame().rename(columns = {'Q7_Part_3':'cnt'})
df21_lan_tw_c=df21_Ea['Q7_Part_4'][df21_Ea['Q3']=='Taiwan'].value_counts().to_frame().rename(columns = {'Q7_Part_4':'cnt'})
df21_lan_tw_cc=df21_Ea['Q7_Part_5'][df21_Ea['Q3']=='Taiwan'].value_counts().to_frame().rename(columns = {'Q7_Part_5':'cnt'})
df21_lan_tw_j=df21_Ea['Q7_Part_6'][df21_Ea['Q3']=='Taiwan'].value_counts().to_frame().rename(columns = {'Q7_Part_6':'cnt'})
df21_lan_tw_js=df21_Ea['Q7_Part_7'][df21_Ea['Q3']=='Taiwan'].value_counts().to_frame().rename(columns = {'Q7_Part_7':'cnt'})
df21_lan_tw_ju=df21_Ea['Q7_Part_8'][df21_Ea['Q3']=='Taiwan'].value_counts().to_frame().rename(columns = {'Q7_Part_8':'cnt'})
df21_lan_tw_sw=df21_Ea['Q7_Part_9'][df21_Ea['Q3']=='Taiwan'].value_counts().to_frame().rename(columns = {'Q7_Part_9':'cnt'})
df21_lan_tw_b=df21_Ea['Q7_Part_10'][df21_Ea['Q3']=='Taiwan'].value_counts().to_frame().rename(columns = {'Q7_Part_10':'cnt'})
df21_lan_tw_ma=df21_Ea['Q7_Part_11'][df21_Ea['Q3']=='Taiwan'].value_counts().to_frame().rename(columns = {'Q7_Part_11':'cnt'})
df21_lan_tw_n=df21_Ea['Q7_Part_12'][df21_Ea['Q3']=='Taiwan'].value_counts().to_frame().rename(columns = {'Q7_Part_12':'cnt'})
tw_lan = pd.concat([df21_lan_tw_p,df21_lan_tw_r,df21_lan_tw_s,df21_lan_tw_c,df21_lan_tw_cc,df21_lan_tw_j,df21_lan_tw_js,df21_lan_tw_ju,df21_lan_tw_sw,df21_lan_tw_b,df21_lan_tw_ma,df21_lan_tw_n])


df21_lan_ko_p=df21_Ea['Q7_Part_1'][df21_Ea['Q3']=='South Korea'].value_counts().to_frame().rename(columns = {'Q7_Part_1':'cnt'})
df21_lan_ko_r=df21_Ea['Q7_Part_2'][df21_Ea['Q3']=='South Korea'].value_counts().to_frame().rename(columns = {'Q7_Part_2':'cnt'})
df21_lan_ko_s=df21_Ea['Q7_Part_3'][df21_Ea['Q3']=='South Korea'].value_counts().to_frame().rename(columns = {'Q7_Part_3':'cnt'})
df21_lan_ko_c=df21_Ea['Q7_Part_4'][df21_Ea['Q3']=='South Korea'].value_counts().to_frame().rename(columns = {'Q7_Part_4':'cnt'})
df21_lan_ko_cc=df21_Ea['Q7_Part_5'][df21_Ea['Q3']=='South Korea'].value_counts().to_frame().rename(columns = {'Q7_Part_5':'cnt'})
df21_lan_ko_j=df21_Ea['Q7_Part_6'][df21_Ea['Q3']=='South Korea'].value_counts().to_frame().rename(columns = {'Q7_Part_6':'cnt'})
df21_lan_ko_js=df21_Ea['Q7_Part_7'][df21_Ea['Q3']=='South Korea'].value_counts().to_frame().rename(columns = {'Q7_Part_7':'cnt'})
df21_lan_ko_ju=df21_Ea['Q7_Part_8'][df21_Ea['Q3']=='South Korea'].value_counts().to_frame().rename(columns = {'Q7_Part_8':'cnt'})
df21_lan_ko_sw=df21_Ea['Q7_Part_9'][df21_Ea['Q3']=='South Korea'].value_counts().to_frame().rename(columns = {'Q7_Part_9':'cnt'})
df21_lan_ko_b=df21_Ea['Q7_Part_10'][df21_Ea['Q3']=='South Korea'].value_counts().to_frame().rename(columns = {'Q7_Part_10':'cnt'})
df21_lan_ko_ma=df21_Ea['Q7_Part_11'][df21_Ea['Q3']=='South Korea'].value_counts().to_frame().rename(columns = {'Q7_Part_11':'cnt'})
df21_lan_ko_n=df21_Ea['Q7_Part_12'][df21_Ea['Q3']=='South Korea'].value_counts().to_frame().rename(columns = {'Q7_Part_12':'cnt'})
ko_lan = pd.concat([df21_lan_ko_p,df21_lan_ko_r,df21_lan_ko_s,df21_lan_ko_c,df21_lan_ko_cc,df21_lan_ko_j,df21_lan_ko_js,df21_lan_ko_ju,df21_lan_ko_sw,df21_lan_ko_b,df21_lan_ko_ma,df21_lan_ko_n])


ch_lan['cnt'].to_list()

languages = ['Python','R','SQL','C','C++','Java','Javascript','Julia','Swift','Bash','MATLAB','None']

fig = go.Figure(data=[
go.Bar(name='China', x = languages,
y = ch_lan['cnt'].tolist()),

go.Bar(name='Japan', x = languages,
y=jp_lan['cnt'].tolist()),

go.Bar(name='South Korea', x = languages,
y=ko_lan['cnt'].tolist()),

go.Bar(name='Taiwan', x = languages,
y=tw_lan['cnt'].tolist())
])

fig.update_layout(title_text="<b>21년 EastAisa kaggler들이 사용하는 언어</b>",title_font_size=35)
fig.show()

Thank you for reading!