kaggle study
- Demographics & Geographics
- (Q1) Age-bar
- (Q2) Gender-pie
- (Q3)countries-scatter+line
- Education & Occupation
- (Q4) Age-bar_h
- (Q5) Role-bar_h
- (Q20) Industry-bar_h
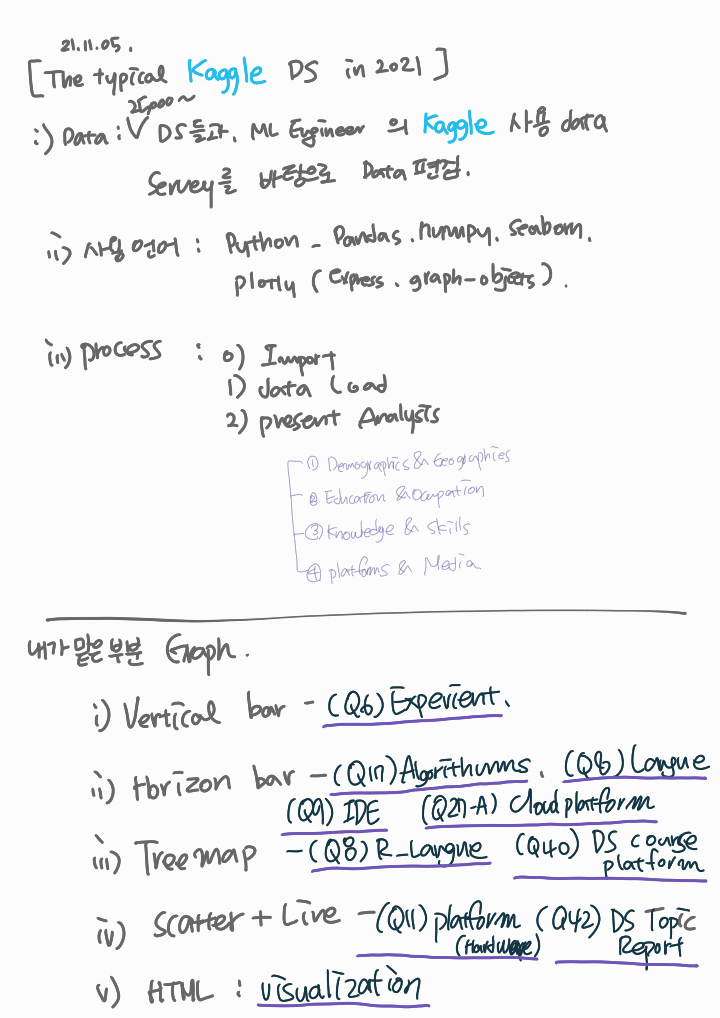
- knowledge & skills
- (Q6) Experience : 52% 넘는 응답이 3년이상 코딩과 프로그래밍을 했다. -bar vertical (위)
- (Q17) Algorithms : Linear or Logistic Regression 55% 과 Decision tree or Random Forests, respectively 66% 사용. - bar horizon (옆)
- (Q7) Languages : python 84%, SQL 41% 사용 -bar horizon
- (Q8) Recommend_Leng: programming에 추천하는 언어는 81%가 python -Treemap
- (Q9) F_EG /w Q7 가장 많이 쓰는 IDE : jupyter Notebook26.2%, VSCODE 13.92% - bar horizon
- Platforms & Media4. Platforms & Media
- (Q11) Platform: 많이 쓰는 컴퓨터 플랫폼은 랩탑이 66% -Scatter + line
- (Q27_A)cloud_platform: 아마존 14%, 구글클라우드 12%, 마쏘 아줠 9% - bar horizon
- (Q40) courses: DS들이 많이 쓰는 course 플랫폼 Coursera 20, Kaggle 18%-Treemap
- (Q42) media : DS topic report를 위해 많이 쓰는 media는 kaggle 44%, youTube 40%, blog 31% -scatter + line
- Takeaways : typical Kaggle DS in 2021 :HTML picture n line n text
1 |
|
/kaggle/input/kaggle-survey-2021/kaggle_survey_2021_responses.csv
/kaggle/input/kaggle-survey-2021/supplementary_data/kaggle_survey_2021_methodology.pdf
/kaggle/input/kaggle-survey-2021/supplementary_data/kaggle_survey_2021_answer_choices.pdf

HTML code는 Markdown 형식으로 넣을 수 있게 해 준다.
scr : 구글 팟케스트에서 바로 연결하여 사용.
1 | import pandas as pd |
시각화, 계산을 위해 Pandas, Numpy, seaborn을 이용 할 것이고, 동적보드를 만들기 위해 plotly를 이용 하였다.
plotly 중에서 Express와 Graph_objects를 가져와서 사용 할 예정인듯.
The Plotly Express API in general offers the following features:
Every PX function returns a** plotly.graph_objects.Figure object**, so you can edit it using all the same methods like update_layout and add_trace.
input으로 Express를 사용 한다면 Graph_objects가 동적 plotly 를 만드는 것 같다. : update 하거나 trace를 가능 하게 하는듯.
실제 필사할 data에서는 어떤 data가 있는지 확인 해 보지 않았지만,
나는 배우는 입장이니 어떤 data가 있는지, 어떤 head가 있는지 확인 해 보도록 한다.
맨 위에 가보면 Note가 생성 될때
/kaggle/input/kaggle-survey-2021/kaggle_survey_2021_responses.csv
/kaggle/input/kaggle-survey-2021/supplementary_data/kaggle_survey_2021_methodology.pdf
/kaggle/input/kaggle-survey-2021/supplementary_data/kaggle_survey_2021_answer_choices.pdf
위와같은 file dir을 알려준다. 이제, pandas로 이 files를 로딩 시켜 주면된다.
Ref. Kaggle활용.국문
1 | df = pd.read_csv("../input/kaggle-survey-2021/kaggle_survey_2021_responses.csv") |
<class 'pandas.core.frame.DataFrame'>
RangeIndex: 25973 entries, 1 to 25973
Columns: 369 entries, Time from Start to Finish (seconds) to Q38_B_OTHER
dtypes: object(369)
memory usage: 73.1+ MB
df에 pd.read_csv로 csv file을 읽어 옵니다.
역시 pd인 df객체에 iloc을 이용하여 [ 1행부터 : , : ] iloc를 선택 해 놓았다.
- 행번호(row number)로 선택하는 방법 (.iloc)
- label이나 조건표현으로 선택하는 방법 (.loc)
Ref. loc를 이용한 행 선택
This notebook will explore the fascinating results obtained from the survey conducted by Kaggle in September 2021. Over 25,000 data scientists and ML engineers participated, providing information on their backgrounds and experience in their occupations.
To increase readability, this report is divided into four sections:
- Demographics & Geographics
- Education & Occupation
- Knowledge & Skills
- Platforms & Media
Introduction
이 노트북은 25000 data scientist들과 ML Engineer들의 kaggle에서 경험 한것을 조사한 data를 매력적인 결과로 탐험 하게 될 것이다.
(대충)
; Introduction 에서 이 notebook의 성격, data의 간간한 정보, 목차 등을 설명.
모든 글은 Markdown을 이용한 css 로 작성 된 것 같다.
혹시,
css
에 대하여 더 알아보고 싶으면, 이 문서를 참조 하자.
